Memorial Day weekend is upon. It’s time to hit the road as vacation season officially kicks off–that is unless you’re like the majority of Americans who’ve cut back on their beach time. In the 1980s, employed Americans took up to 21 days of paid vacation each year. By 2013, that number had shrunk to 16, according to research performed by Oxford Economics for Project Time Off.
To read more about America’s vacation problem, see this week’s TIME magazine.
It’s important to note many employees do have access to vacation. Data from the Bureau of Labor Statistics (BLS) shows that access to paid time off (PTO) remains above 90 percent among private industry employees, shrinking only 2 percentage points since 1989.
Access to paid vacation 1989-2014
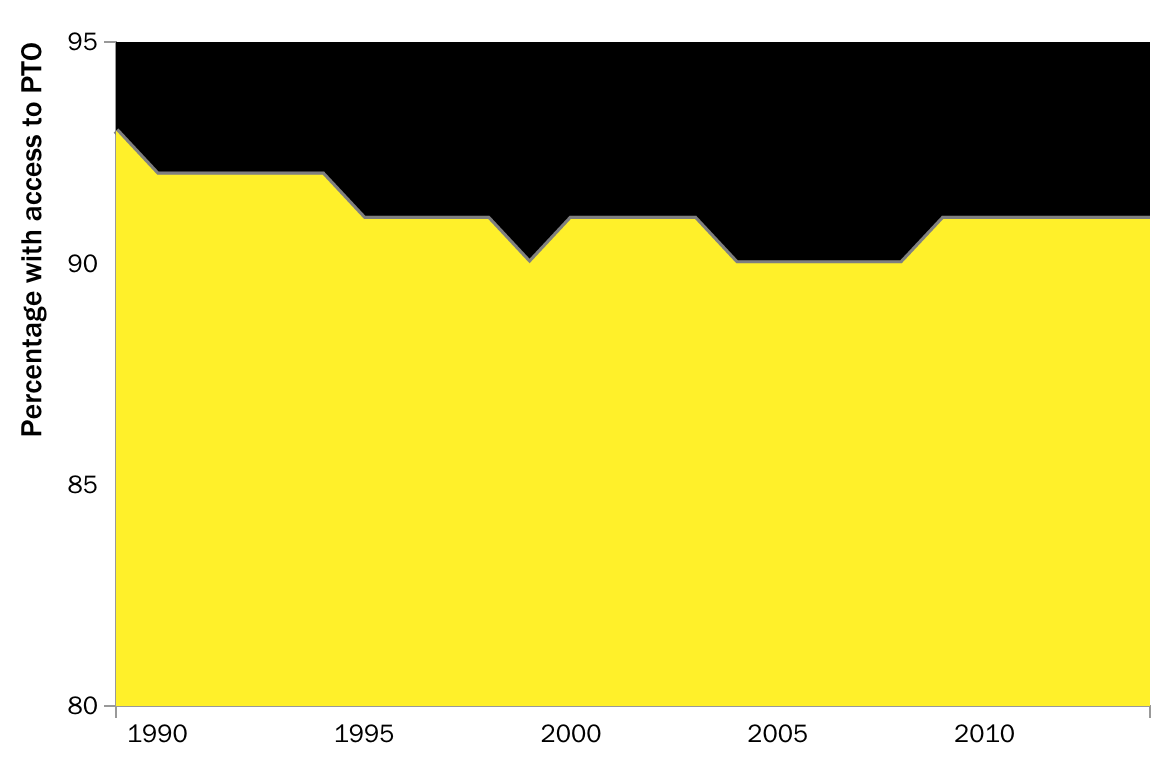
The chart above includes all full-time employees in private industries–the primary employers in the U.S.–including small and large businesses. “Larger companies traditionally offer relatively good access to benefits, like paid time off”, says Elizabeth Ashack, an economist with BLS. But the availability of paid vacation varies greatly among occupations within the private industry.
Access to paid vacation by sector in 2014
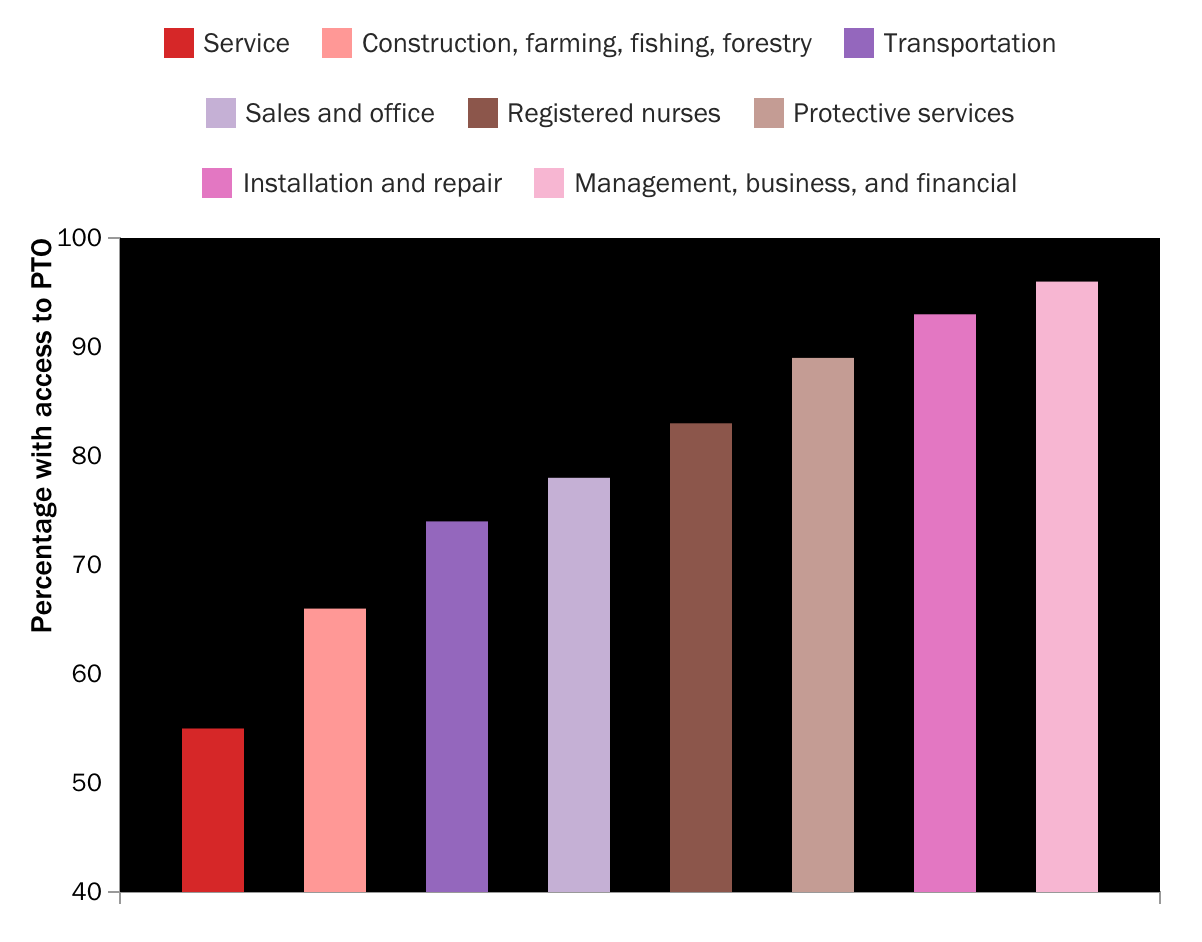
Only 55 percent of service jobs offer paid time off (compare that to management and financial positions which come in at 96 percent, the highest level among the above occupations). Without a federal mandate for paid time off or paid sick leave, private industries are left to their own discretion, often resulting in unequal access across occupations.
Ashack says that employers may offer better benefits to keep workers from jumping ship in good times, but in bad times those benefits worsen, evidenced by cuts during the economic downturn of 2008 to 2009.
Likewise, the amount someone makes is a good indicator of the quality of paid time off they receive.
Access to paid vacation by income groups 2014
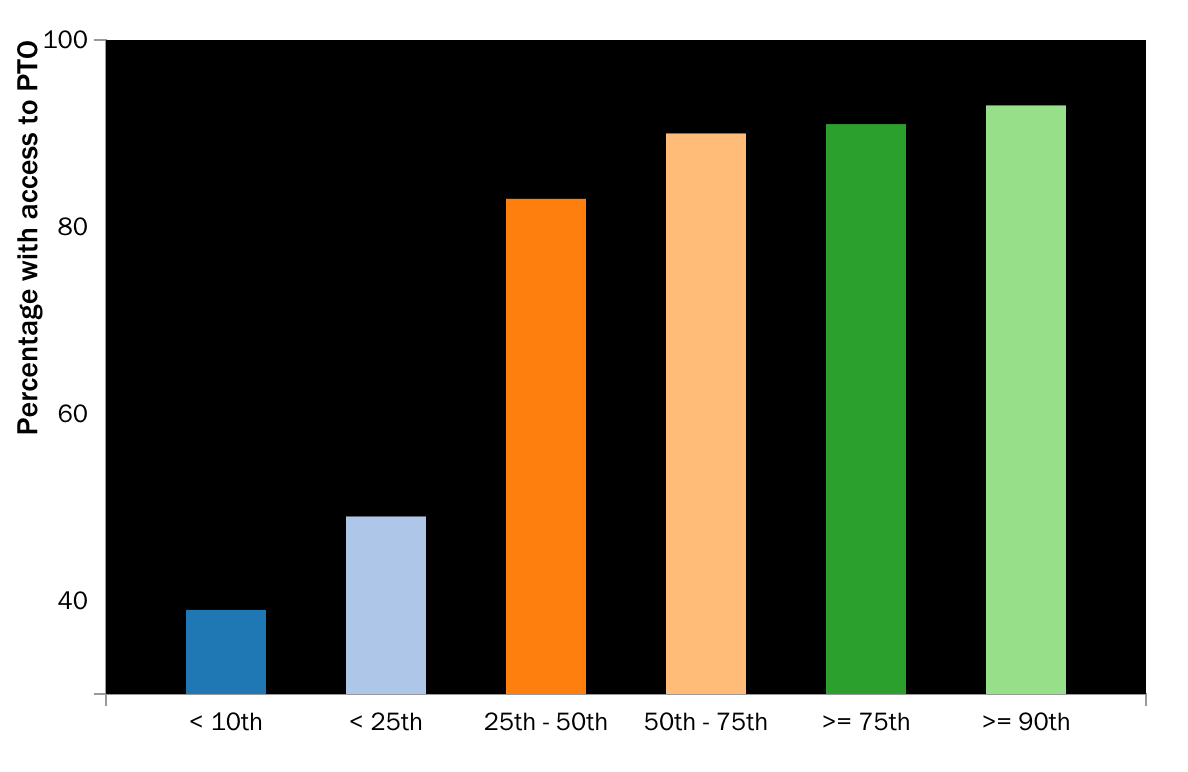
Those making the lowest wages are the least likely to have paid leave, with a steady increase in access as wages rise.
For those with access, the use of paid time off has declined sharply in the past decade to an average of 16 days taken each year–an all time low within the past four decades.
Annual vacation days used among employed adults 1978 – 2013
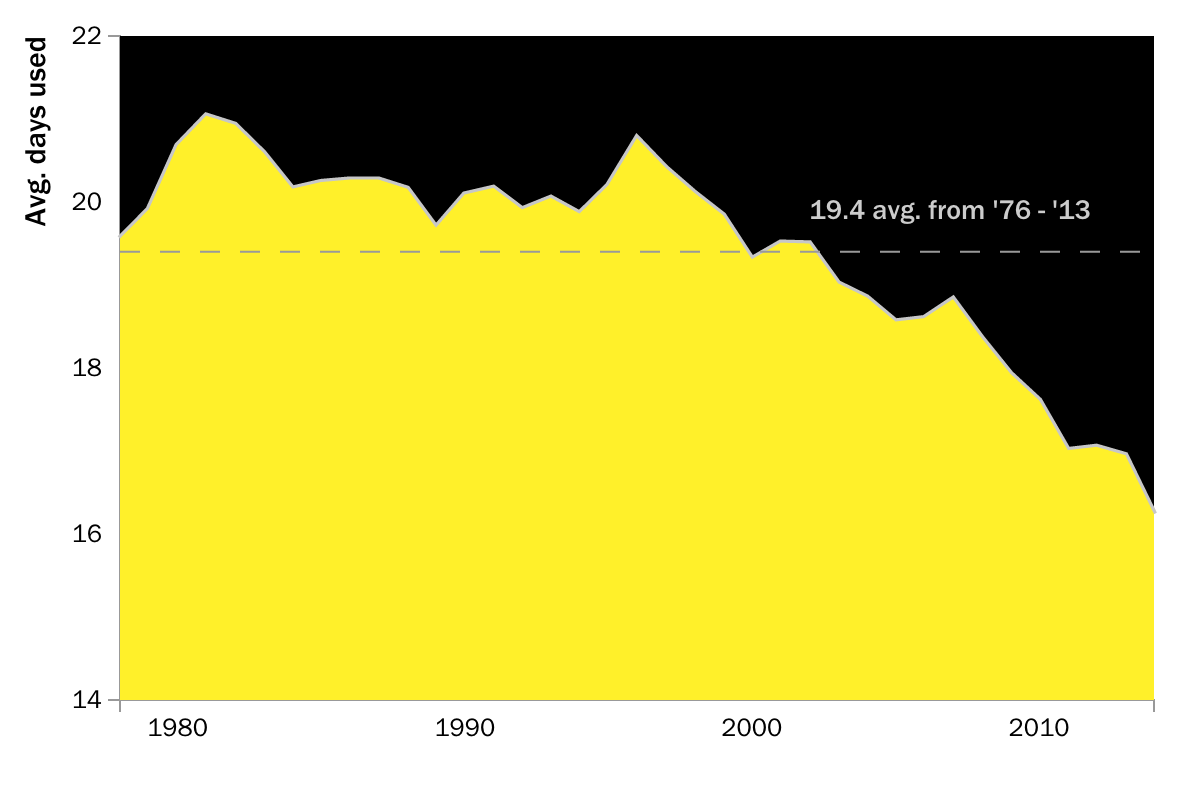
The U.S. Travel Association, a trade group which encourages Americans to travel, funded Project Time Off to measure the economic impact of the decline in vacation time. They found that among employees with access to paid time off, nearly five days went unused in 2013, and 1.6 of those days did not carry over to the next year. That totals to 169 million days of lost vacation time for Americans.
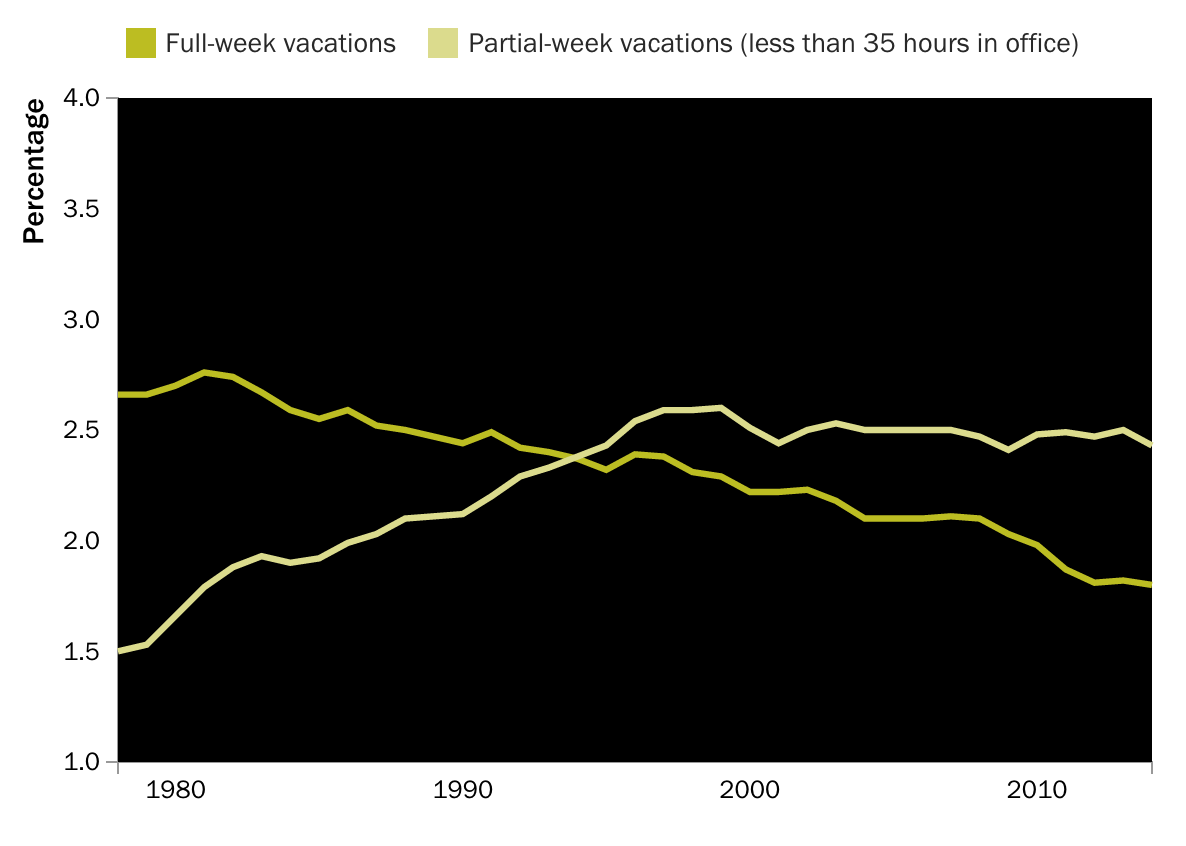
By surveying the hours worked by employees, BLS measures the percent of the American workforce on partial (less than 35 hour work week) or full vacations on any given week. Analysts noticed a decrease in full-week vacations, and a corresponding increase in partial week vacations, yet another measure indicating that Americans need a break.
Percentage of employed adults on full or partial-week vacations 1978 – 2013
More Must-Reads From TIME
- The 100 Most Influential People of 2024
- How Far Trump Would Go
- Scenes From Pro-Palestinian Encampments Across U.S. Universities
- Saving Seconds Is Better Than Hours
- Why Your Breakfast Should Start with a Vegetable
- 6 Compliments That Land Every Time
- Welcome to the Golden Age of Ryan Gosling
- Want Weekly Recs on What to Watch, Read, and More? Sign Up for Worth Your Time
Contact us at letters@time.com