Like many of the virus’s hardest hit victims, the United States went into the COVID-19 pandemic wracked by preexisting conditions. A fraying public health infrastructure, inadequate medical supplies, an employer-based health insurance system perversely unsuited to the moment—these and other afflictions are surely contributing to the death toll. But in addressing the causes and consequences of this pandemic—and its cruelly uneven impact—the elephant in the room is extreme income inequality.
How big is this elephant? A staggering $50 trillion. That is how much the upward redistribution of income has cost American workers over the past several decades.
This is not some back-of-the-napkin approximation. According to a groundbreaking new working paper by Carter C. Price and Kathryn Edwards of the RAND Corporation, had the more equitable income distributions of the three decades following World War II (1945 through 1974) merely held steady, the aggregate annual income of Americans earning below the 90th percentile would have been $2.5 trillion higher in the year 2018 alone. That is an amount equal to nearly 12 percent of GDP—enough to more than double median income—enough to pay every single working American in the bottom nine deciles an additional $1,144 a month. Every month. Every single year.
Price and Edwards calculate that the cumulative tab for our four-decade-long experiment in radical inequality had grown to over $47 trillion from 1975 through 2018. At a recent pace of about $2.5 trillion a year, that number we estimate crossed the $50 trillion mark by early 2020. That’s $50 trillion that would have gone into the paychecks of working Americans had inequality held constant—$50 trillion that would have built a far larger and more prosperous economy—$50 trillion that would have enabled the vast majority of Americans to enter this pandemic far more healthy, resilient, and financially secure.
As the RAND report [whose research was funded by the Fair Work Center which co-author David Rolf is a board member of] demonstrates, a rising tide most definitely did not lift all boats. It didn’t even lift most of them, as nearly all of the benefits of growth these past 45 years were captured by those at the very top. And as the American economy grows radically unequal it is holding back economic growth itself.
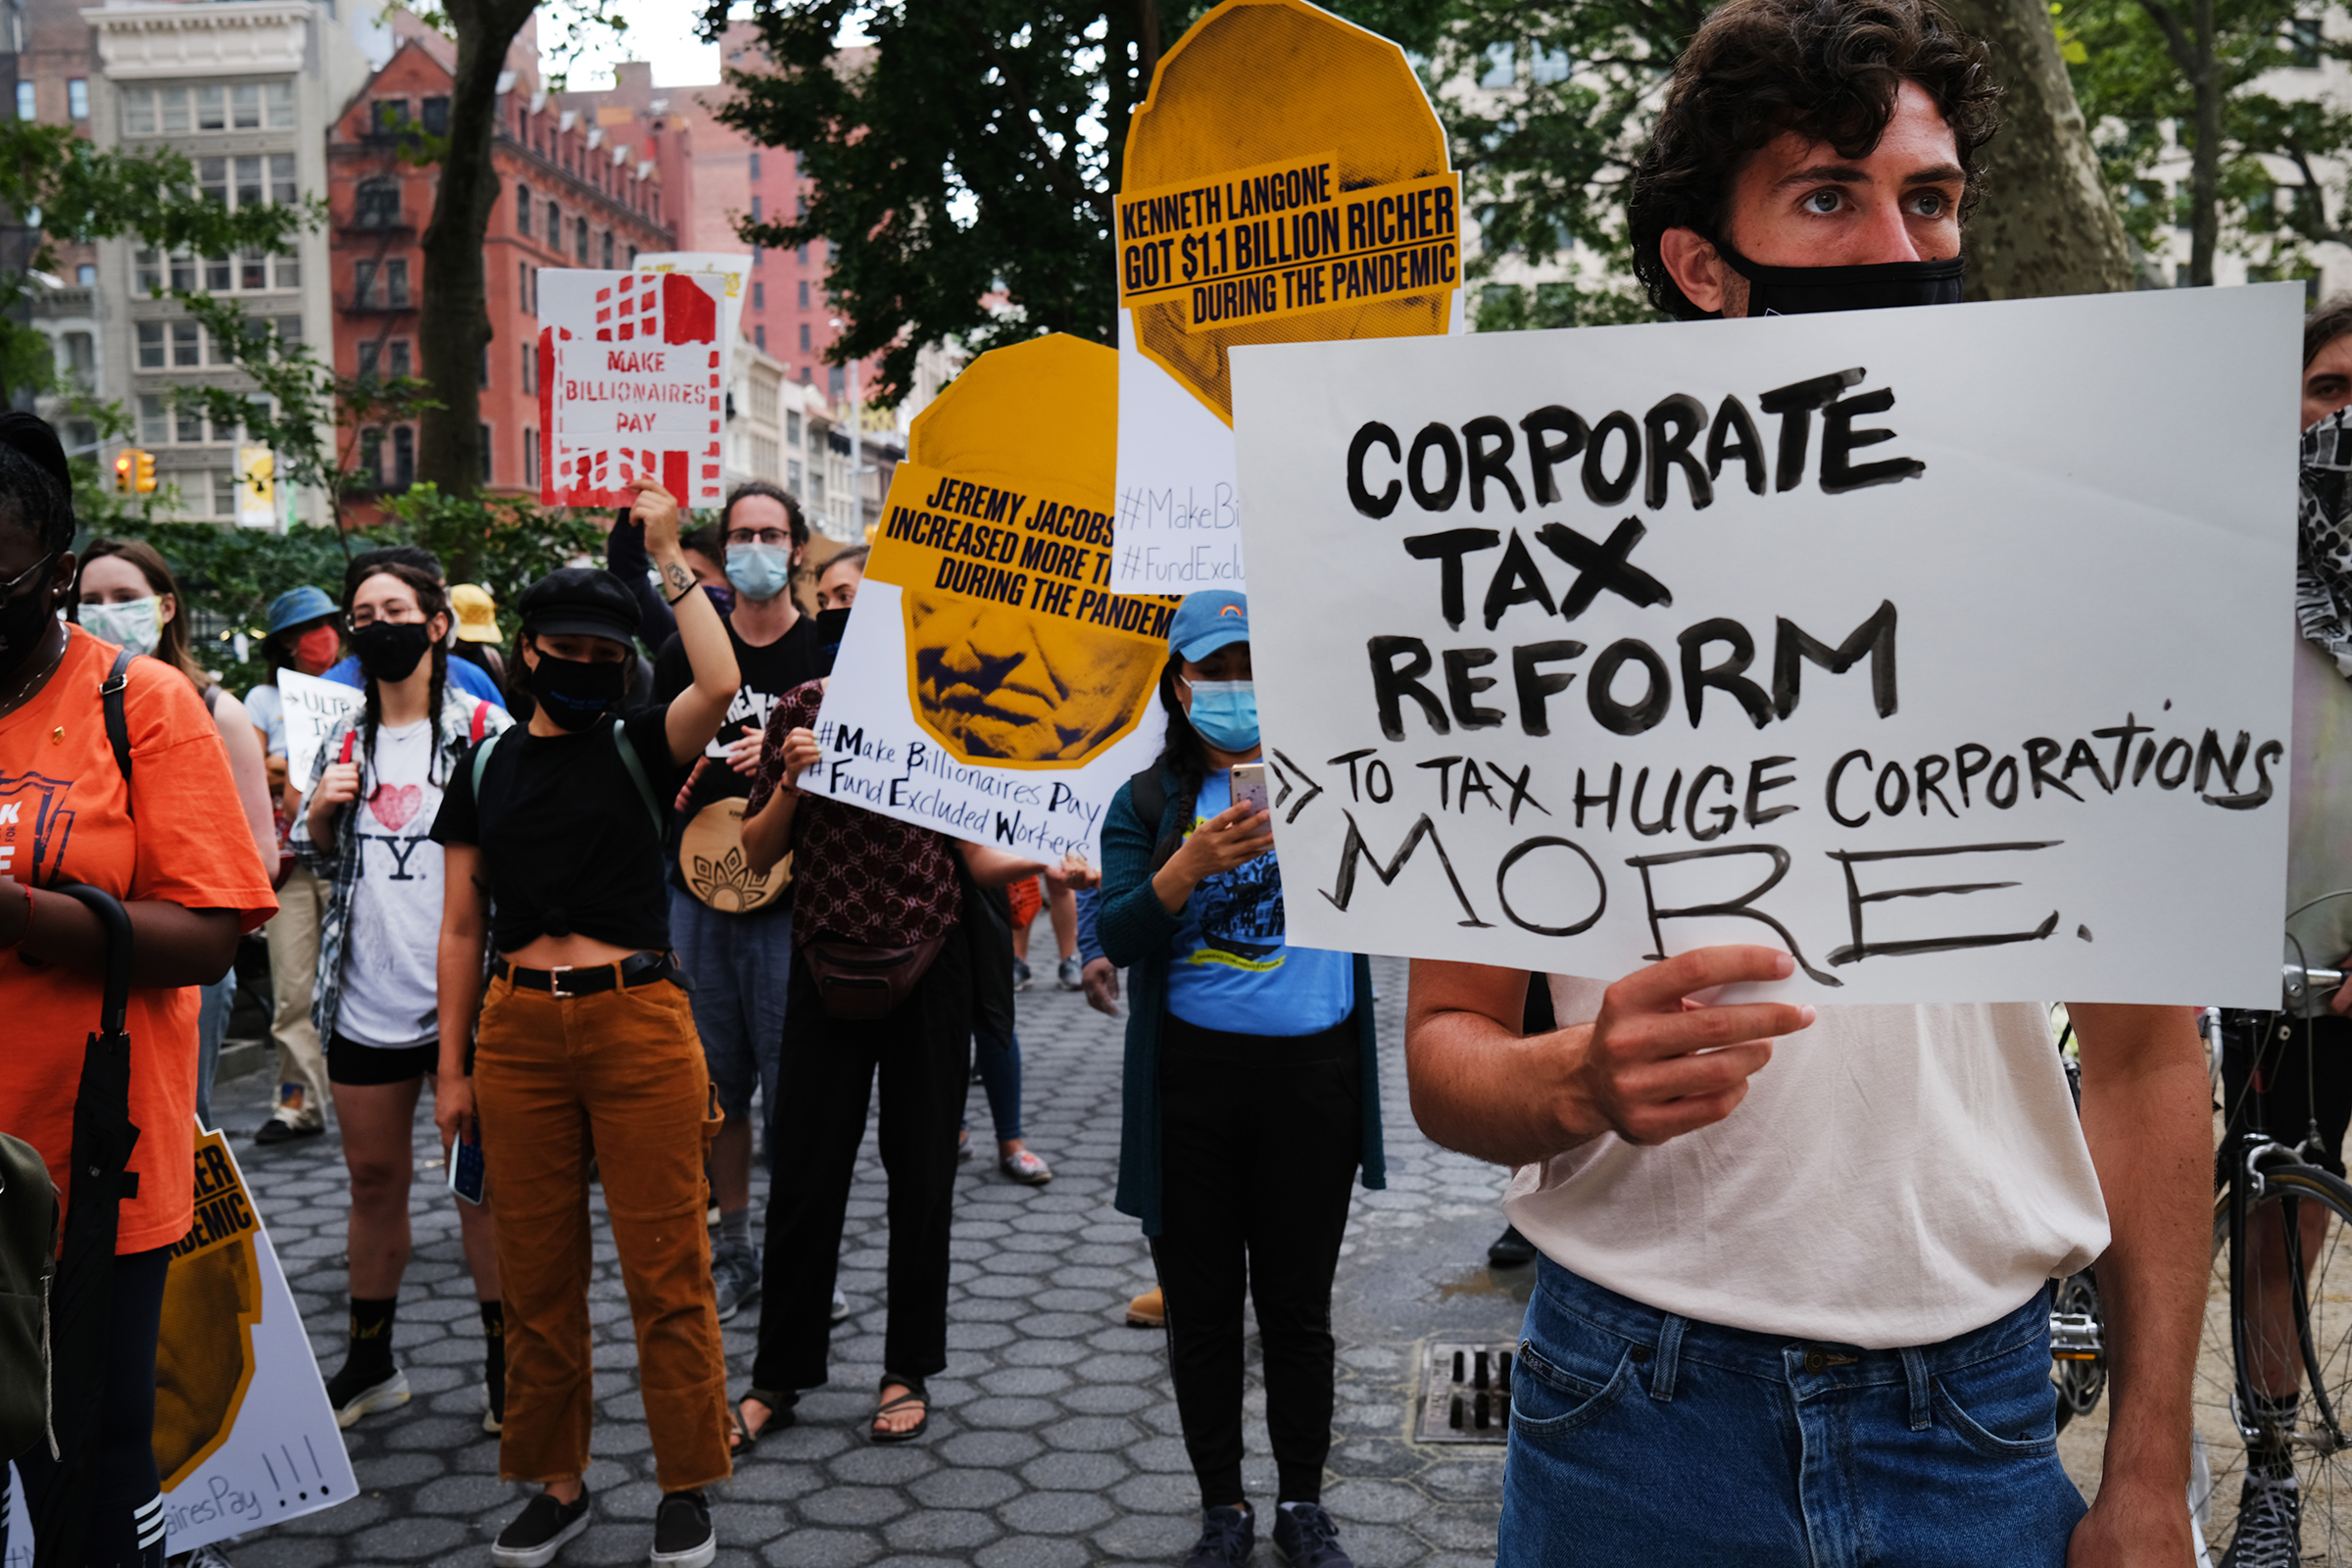
Even inequality is meted out unequally. Low-wage workers and their families, disproportionately people of color, suffer from far higher rates of asthma, hypertension, diabetes, and other COVID-19 comorbidities; yet they are also far less likely to have health insurance, and far more likely to work in “essential” industries with the highest rates of coronavirus exposure and transmission. It is no surprise then, according to the CDC, that COVID-19 inflicts “a disproportionate burden of illness and death among racial and ethnic minority groups.” But imagine how much safer, healthier, and empowered all American workers might be if that $50 trillion had been paid out in wages instead of being funneled into corporate profits and the offshore accounts of the super-rich. Imagine how much richer and more resilient the American people would be. Imagine how many more lives would have been saved had our people been more resilient.
It is easy to see how such a deadly virus, and the draconian measures required to contain it, might spark an economic depression. But look straight into the eyes of the elephant in the room, and it is impossible to deny the many ways in which our extreme inequality—an exceptionally American affliction—has made the virus more deadly and its economic consequences more dire than in any other advanced nation. Why is our death toll so high and our unemployment rate so staggeringly off the charts? Why was our nation so unprepared, and our economy so fragile? Why have we lacked the stamina and the will to contain the virus like most other advanced nations? The reason is staring us in the face: a stampede of rising inequality that has been trampling the lives and livelihoods of the vast majority of Americans, year after year after year.
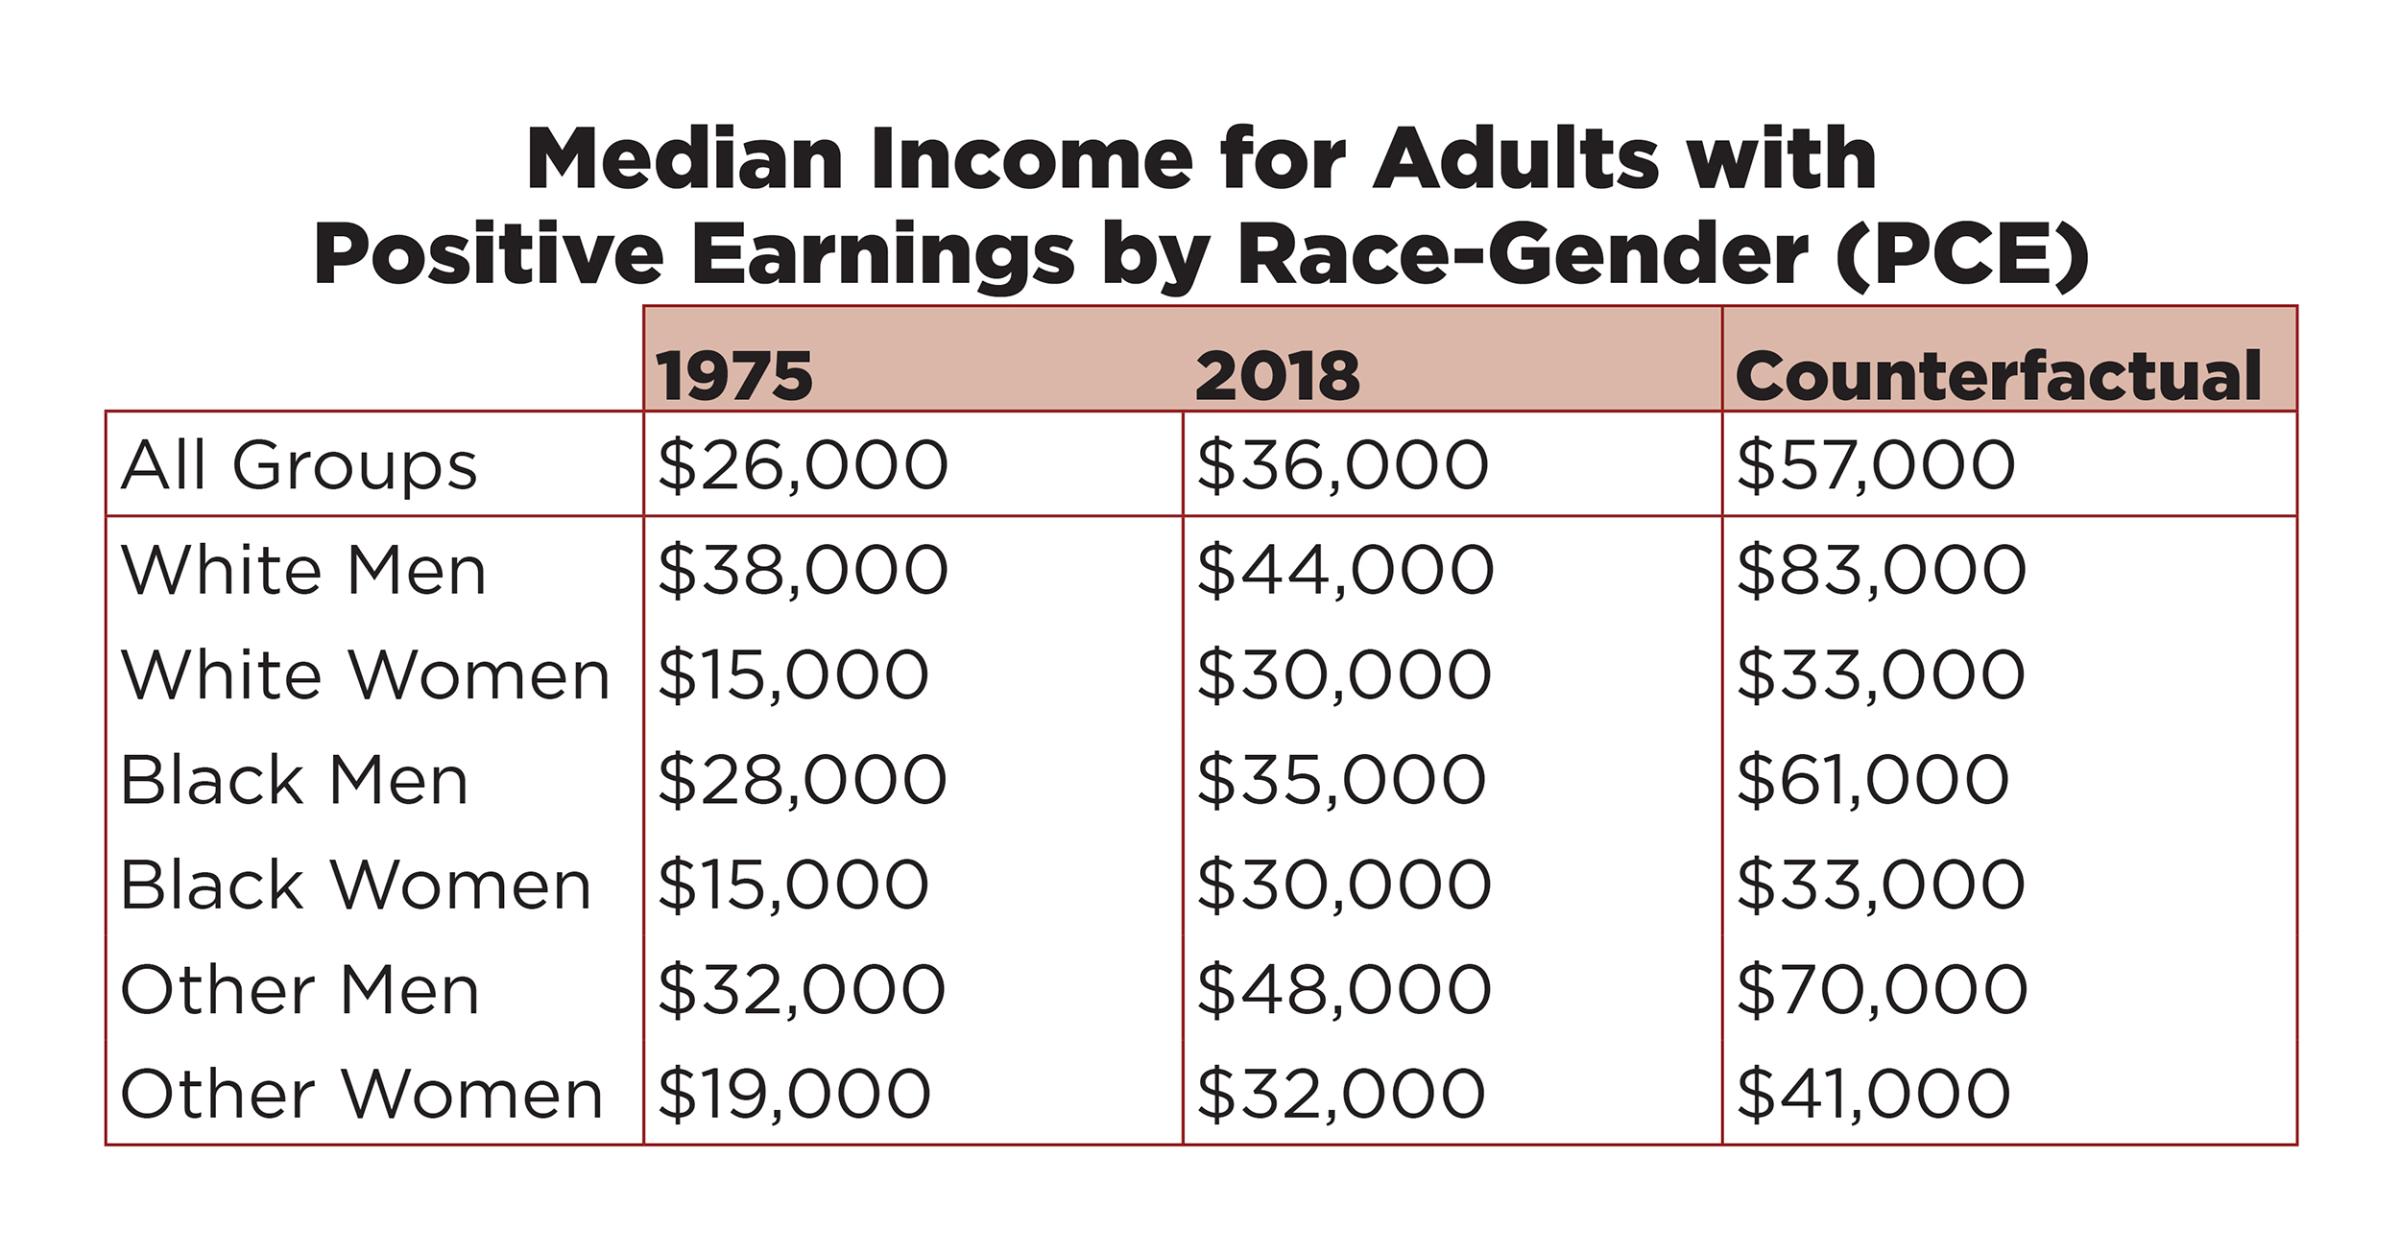
Of course, America’s chronic case of extreme inequality is old news. Many other studies have documented this trend, chronicled its impact, and analyzed its causes. But where others have painted the picture in terms of aggregate shares of GDP, productivity growth, or other cold, hard statistics, the RAND report brings the inequality price tag directly home by denominating it in dollars—not just the aggregate $50 trillion figure, but in granular demographic detail. For example, are you a typical Black man earning $35,000 a year? You are being paid at least $26,000 a year less than you would have had income distributions held constant. Are you a college-educated, prime-aged, full-time worker earning $72,000? Depending on the inflation index used (PCE or CPI, respectively), rising inequality is costing you between $48,000 and $63,000 a year. But whatever your race, gender, educational attainment, urbanicity, or income, the data show, if you earn below the 90th percentile, the relentlessly upward redistribution of income since 1975 is coming out of your pocket.

As Price and Edwards explain, from 1947 through 1974, real incomes grew close to the rate of per capita economic growth across all income levels. That means that for three decades, those at the bottom and middle of the distribution saw their incomes grow at about the same rate as those at the top. This was the era in which America built the world’s largest and most prosperous middle class, an era in which inequality between income groups steadily shrank (even as shocking inequalities between the sexes and races largely remained). But around 1975, this extraordinary era of broadly shared prosperity came to an end. Since then, the wealthiest Americans, particularly those in the top 1 percent and 0.1 percent, have managed to capture an ever-larger share of our nation’s economic growth—in fact, almost all of it—their real incomes skyrocketing as the vast majority of Americans saw little if any gains.
What if American prosperity had continued to be broadly shared—how much more would a typical worker be earning today? Once the data are compiled, answering these questions is fairly straightforward. Price and Edwards look at real taxable income from 1975 to 2018. They then compare actual income distributions in 2018 to a counterfactual that assumes incomes had continued to keep pace with growth in per capita Gross Domestic Product (GDP)—a 118% increase over the 1975 income numbers. Whether measuring inflation using the more conservative Personal Consumption Expenditures Price Index (PCE) or the more commonly cited Consumer Price Index for all Urban Consumers (CPI-U-RS), the results are striking.
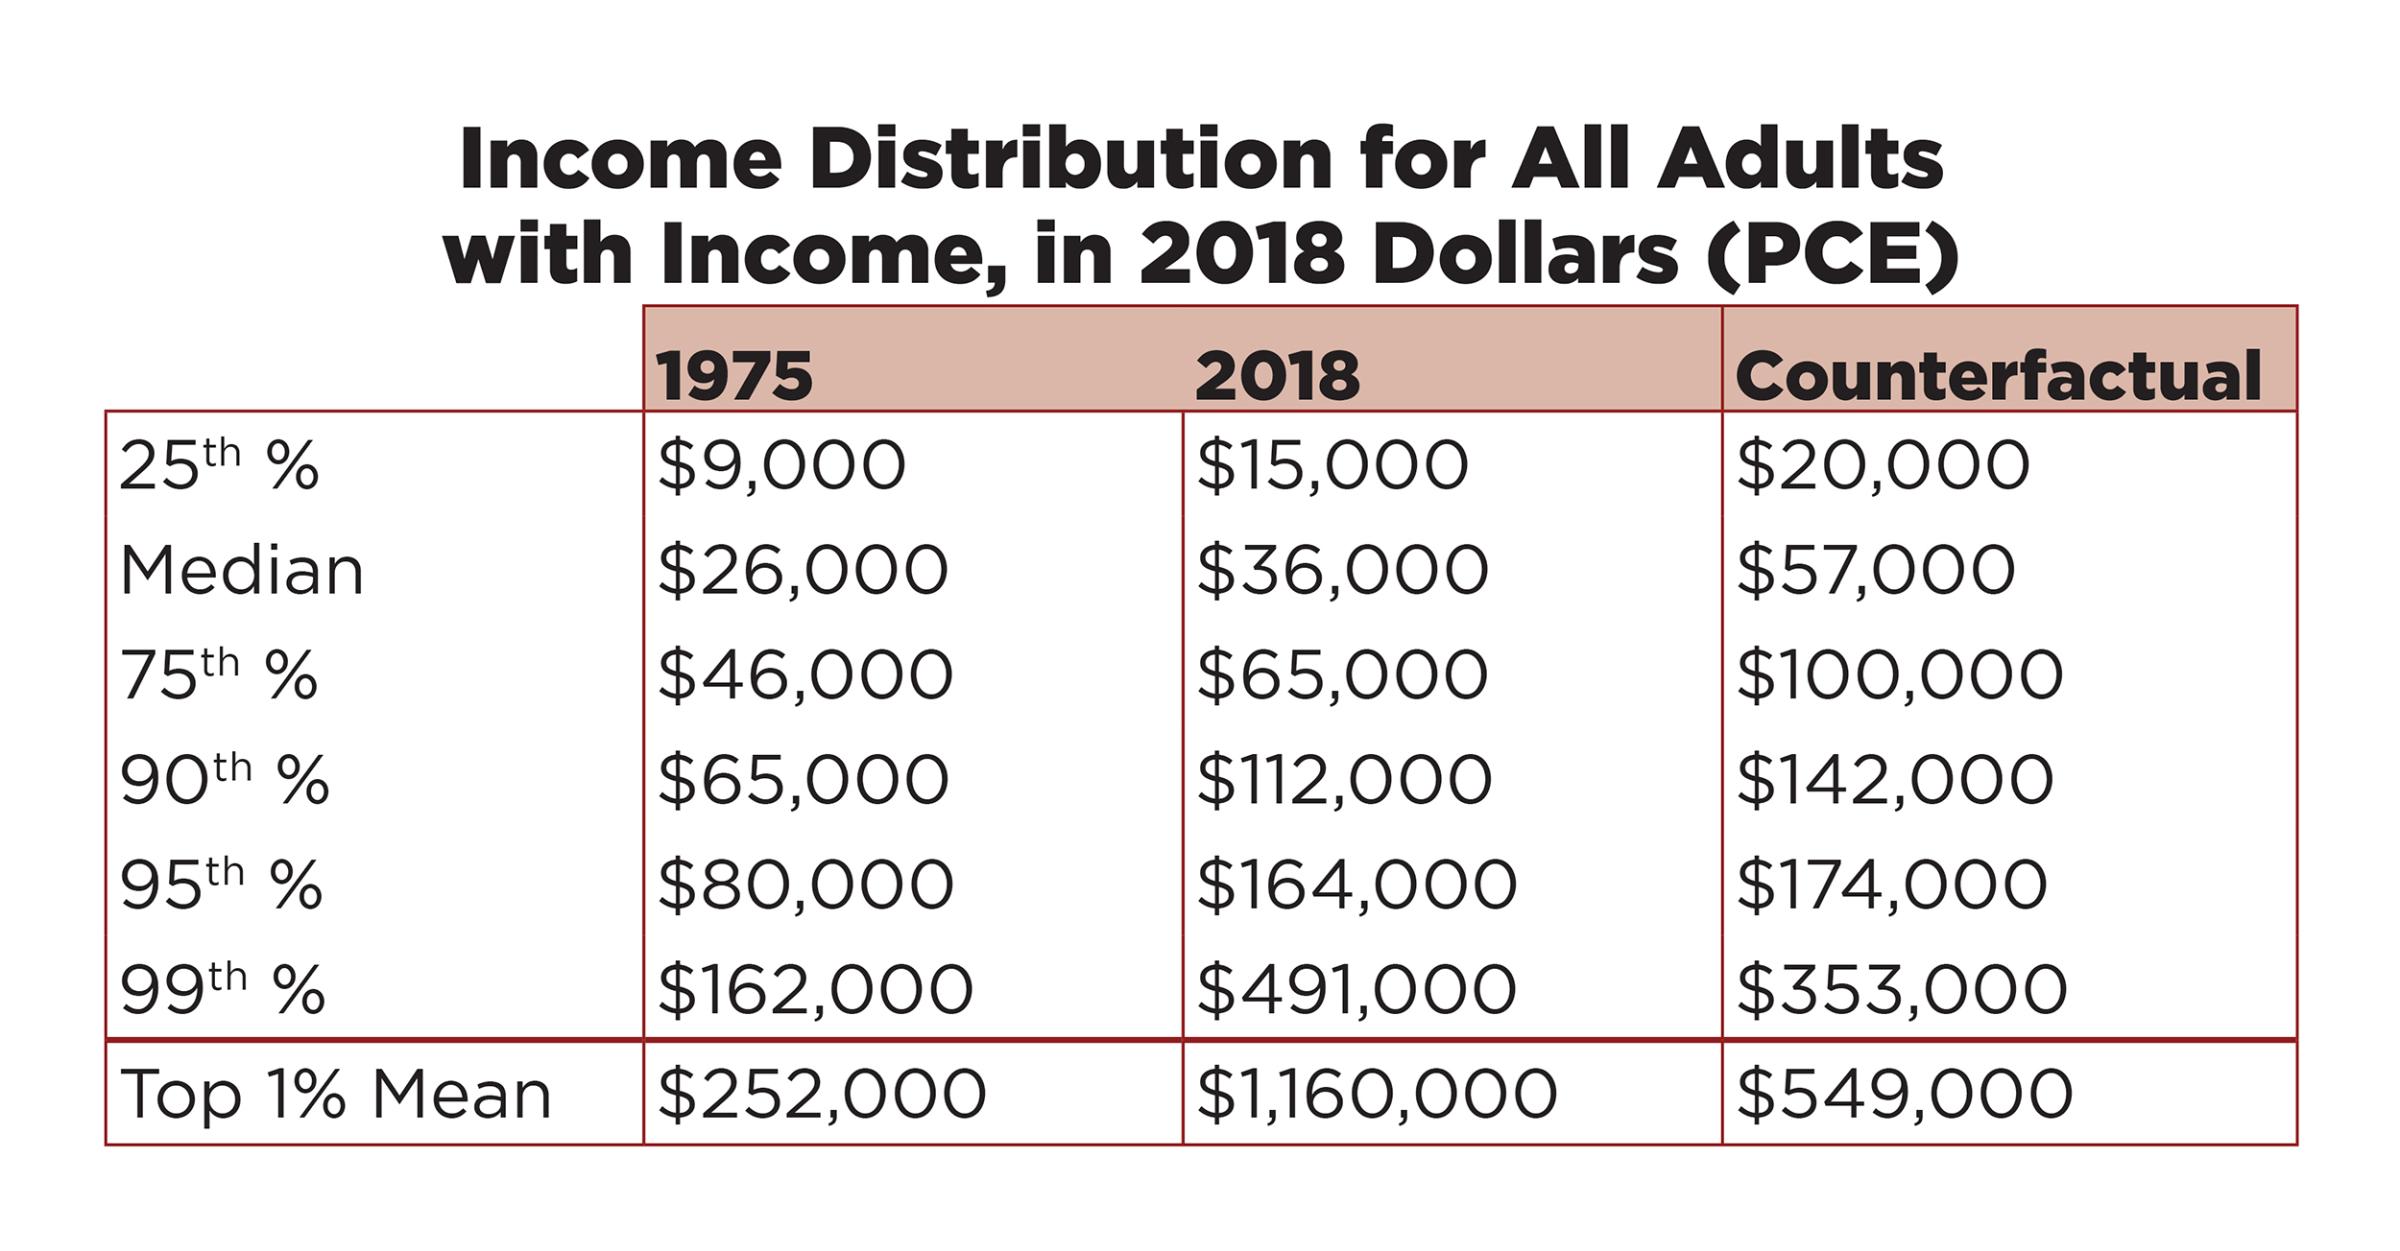
At every income level up to the 90th percentile, wage earners are now being paid a fraction of what they would have had inequality held constant. For example, at the median individual income of $36,000, workers are being shortchanged by $21,000 a year—$28,000 when using the CPI—an amount equivalent to an additional $10.10 to $13.50 an hour. But according to Price and Edwards, this actually understates the impact of rising inequality on low- and middle-income workers, because much of the gains at the bottom of the distribution were largely “driven by an increase in hours not an increase in wages.” To adjust for this, along with changing patterns of workforce participation, the researchers repeat their analysis for full-year, full-time, prime-aged workers (age 25 to 54). These results are even more stark: “Unlike the growth patterns in the 1950s and 60s,” write Price and Edwards, “the majority of full-time workers did not share in the economic growth of the last forty years.”
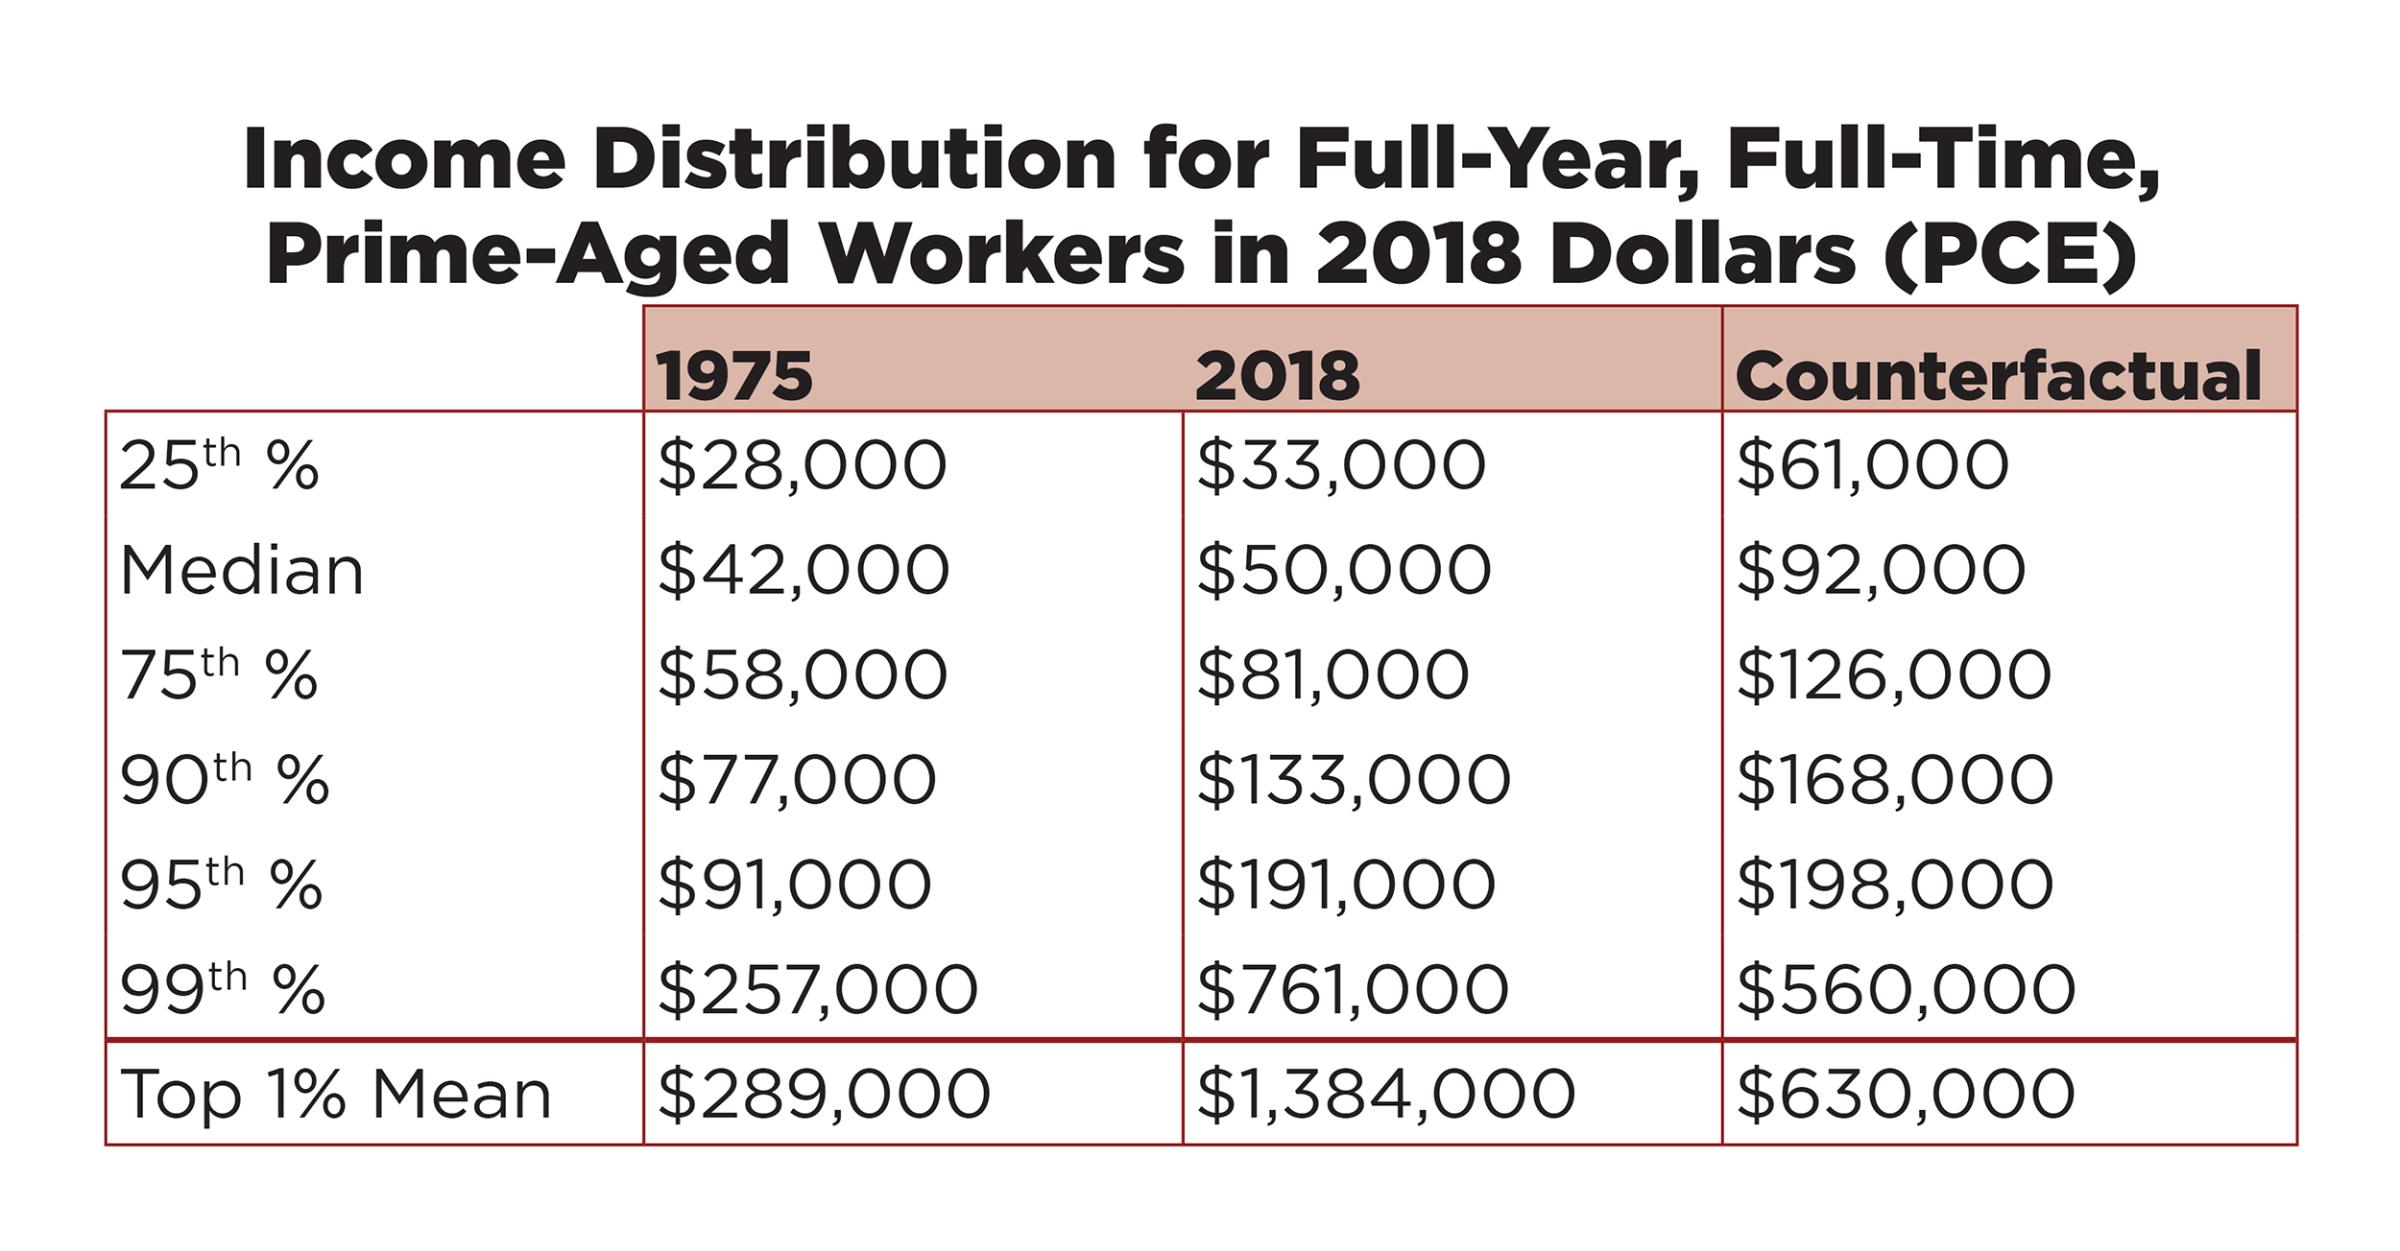
On average, extreme inequality is costing the median income full-time worker about $42,000 a year. Adjusted for inflation using the CPI, the numbers are even worse: half of all full-time workers (those at or below the median income of $50,000 a year) now earn less than half what they would have had incomes across the distribution continued to keep pace with economic growth. And that’s per worker, not per household. At both the 25th and 50th percentiles, households comprised of a married couple with one full-time worker earned thousands of dollars less in 2018 dollars than a comparable household in 1975—and $50,000 and $66,000 less respectively than if inequality had held constant—a predicament compounded by the rising costs of maintaining a dignified middle-class life. According to Oren Cass, executive director of the conservative think tank American Compass, the median male worker needed 30 weeks of income in 1985 to pay for housing, healthcare, transportation, and education for his family. By 2018, that “Cost of Thriving Index” had increased to 53 weeks (more weeks than in an actual year). But the counterfactual reveals an even starker picture: In 2018, the combined income of married households with two full-time workers was barely more than what the income of a single-earner household would have earned had inequality held constant. Two-income families are now working twice the hours to maintain a shrinking share of the pie, while struggling to pay housing, healthcare, education, childcare, and transportations costs that have grown at two to three times the rate of inflation.
This dramatic redistribution of income from the majority of workers to those at the very top is so complete that even at the 95th percentile, most workers are still earning less than they would have had inequality held constant. It is only at the 99th percentile that we see incomes growing faster than economic growth: at 171 percent of the rate of per capita GDP. But even this understates the disparity. “The average income growth for the top one percent was substantially higher,” write Price and Edwards, “at more than 300 percent of the real per capita GDP rate.” The higher your income, the larger your percentage gains. As a result, the top 1 percent’s share of total taxable income has more than doubled, from 9 percent in 1975, to 22 percent in 2018, while the bottom 90 percent have seen their income share fall, from 67 percent to 50 percent. This represents a direct transfer of income—and over time, wealth—from the vast majority of working Americans to a handful at the very top.

But given the changing demographic composition of the U.S. workforce, these topline numbers can only tell part of the story. The U.S. workforce is now better educated and more urban than it was in 1975. It is also far less white and male—with white men falling from over 60 percent of the prime-aged workforce in 1974 to less than 45 percent by 2018. These changes are important, because while there was far more equality between the income distributions in 1975, there was also more inequality within them—notably in regard to gender and race.
For example, in 1975, the median income of white women was only 31 percent of that of white men; by 2018 white women were earning 68 percent as much. Likewise, the median income of Black men as a share of their white counterparts’ earnings rose from 74 percent in 1975, to 80 percent in 2018. Clearly, income disparities between races, and especially between men and women, have narrowed since 1975, and that is a good thing. But unfortunately, much of the narrowing we see is more an artifact of four decades of flat or declining wages for low- and middle-income white men than it is of substantial gains for women and nonwhites.
Much has been made about white male grievance in the age of Trump, and given their falling or stagnant real incomes, one can understand why some white men might feel aggrieved. White, non-urban, non-college educated men have the slowest wage growth in every demographic category. But to blame their woes on competition from women or minorities would be to completely miss the target. In fact, white men still earn more than white women at all income distributions, and substantially more than most non-white men and women. Only Asian-American men earn higher. Yet there is no moral or practical justification for the persistence of any income disparity based on race or gender.
The counterfactuals in the table above appear vastly unequal because they extrapolate from the indefensible 1975-levels of race and gender inequality; they assume that inequality remained constant both between income distributions and within them—that women and nonwhites had not narrowed the income gap with white men. But surely, this cannot be our goal. In an economy freed from race and gender bias, and that shares the fruits of growth broadly across all income distributions, the most appropriate counterfactual for all the groups in this table would be the aggregate counterfactual for “All Groups”: a median income of $57,000 a year for all adults with positive earnings ($92,000 for full-time prime-age workers). That would be the income for all workers at the 50th percentile, regardless of race or gender, had race and gender inequality within distributions been eliminated, and inequality between distributions not grown. By this measure we can see that in real dollars, women and nonwhites have actually lost more income to rising inequality than white men, because starting from their disadvantaged positions in 1975, they had far more to potentially gain. Per capita GDP grew by 118 percent over the following four decades, so there was plenty of new income to spread around. That the majority of white men have benefited from almost none of this growth isn’t because they have lost income to women or minorities; it’s because they’ve lost it to their largely white male counterparts in the top 1 percent who have captured nearly all of the income growth for themselves. According to economist Thomas Piketty, men accounted for 85 percent of the top income centile in the mid-2010s—and while he doesn’t specify, these men are overwhelmingly white.
Thus, by far the single largest driver of rising inequality these past forty years has been the dramatic rise in inequality between white men.
The data on income distribution by educational attainment is equally revealing, in that it calls the lie on the notion of a “skills gap”—a dominant narrative that has argued that rising inequality is largely a consequence of a majority of American workers failing to acquire the higher skills necessary to compete in our modern global economy. If workers were better educated, this narrative argues, they would earn more money. Problem solved.
Indeed, at every income distribution, the education premium has increased since 1975, with the income of college graduates rising faster than their less educated counterparts. But this growing gap is more a consequence of falling incomes for workers without a college degree than it is of rising real incomes for most workers with one—for not only have workers without a degree secured none of the gains from four decades of economic growth, below the 50th percentile they’ve actually seen their real incomes decline. College educated workers are doing better. The median real income for full-time workers with a four-year degree has grown from $55,000 a year in 1975 to $72,000 in 2018. But that still falls far short of the $120,000 they’d be earning had incomes grown with per capita GDP. Even at the 90th percentile, a college educated full-time worker making $191,000 a year is earning less than 78 percent what they would have had inequality held constant.
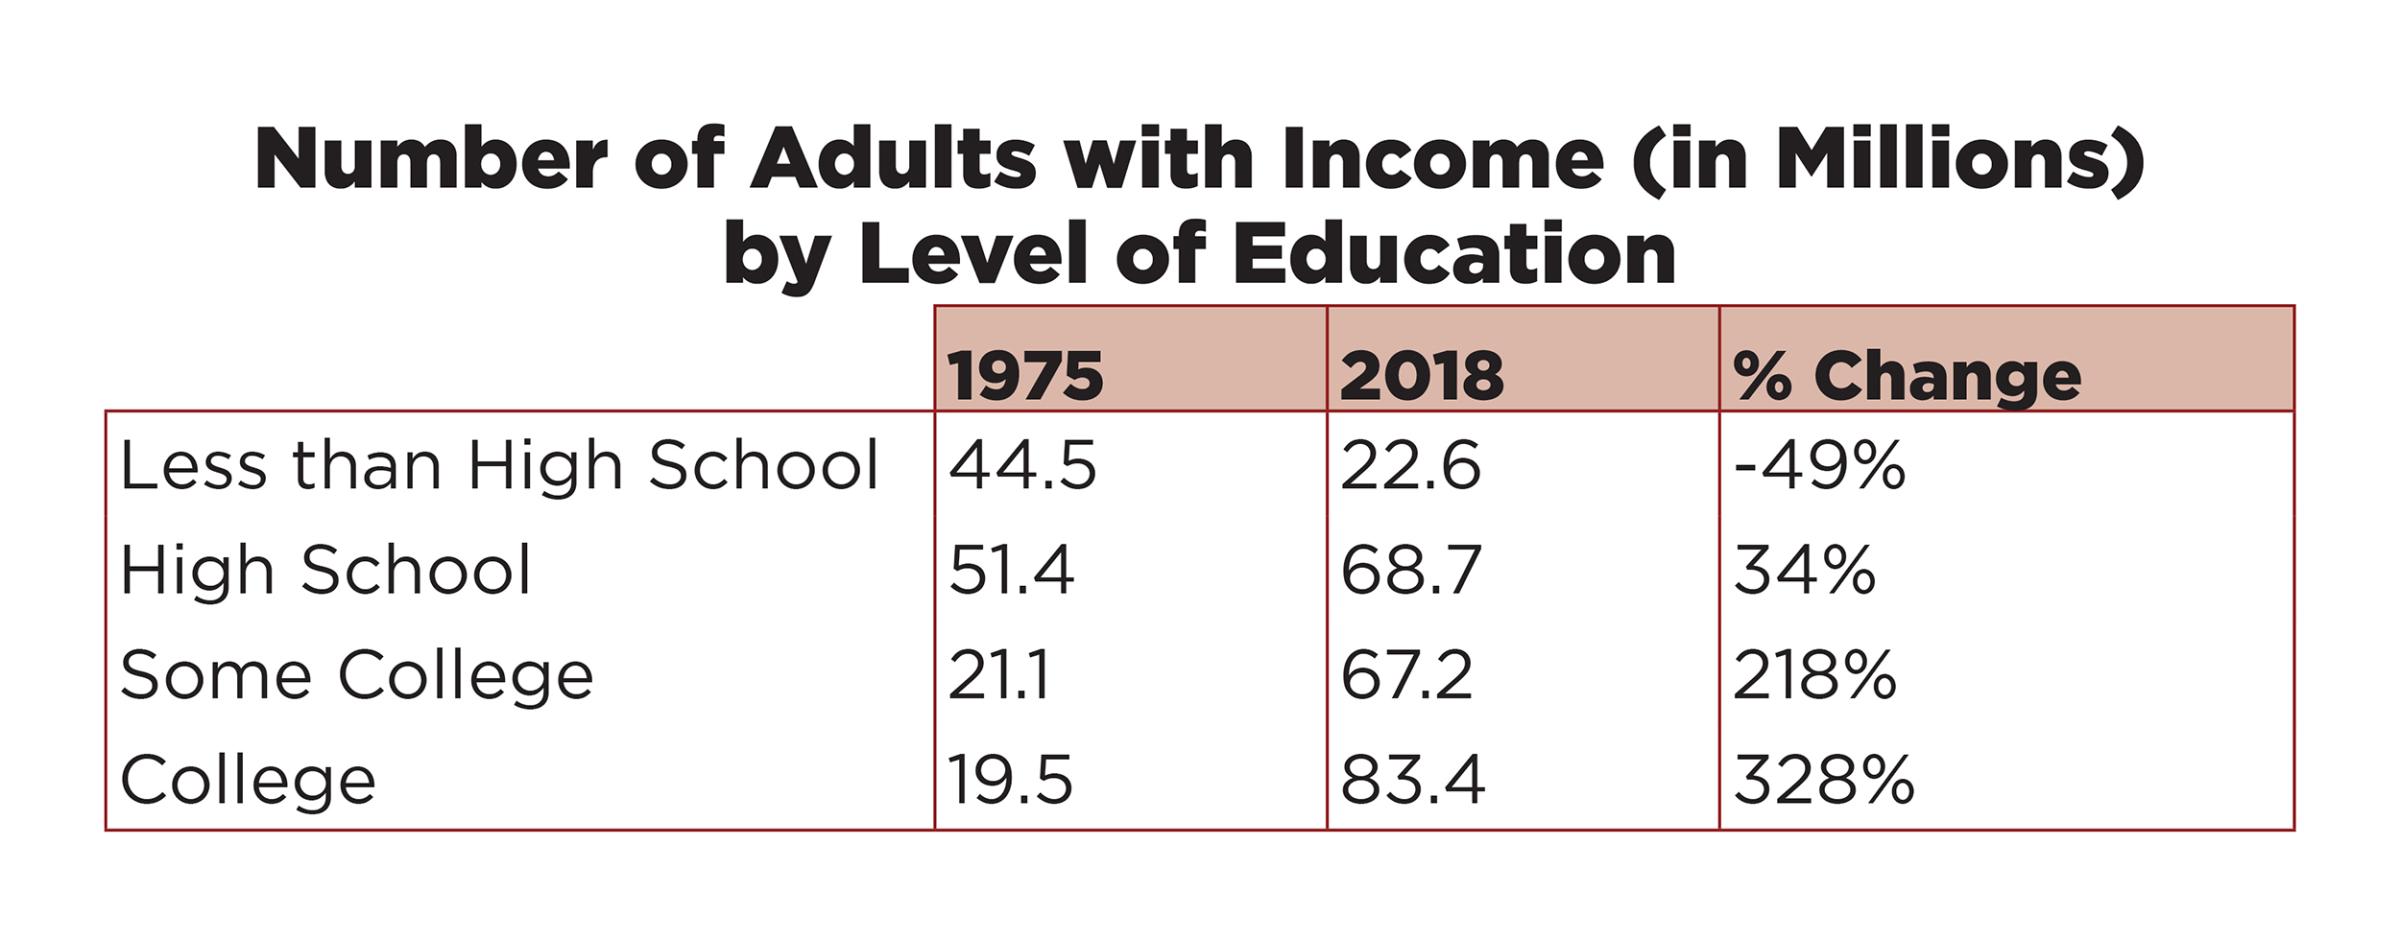
The reality is that American workers have never been more highly educated. In 1975, only 67 percent of the adult US workforce had a high school education or better, while just 15 percent had earned a four-year college degree. By 2018, 91 percent of adult workers had completed high school, while the percentage of college graduates in the workforce had more than doubled to 34 percent. In raw numbers, the population of adult workers with a high school education or less has fallen since 1975, while the number of workers with a four-year degree has more than quadrupled.
It is impossible to argue that a “skills gap” is responsible for rising income inequality when the rate of educational attainment is rising faster than the rate of growth in productivity or per capita GDP. Yes, workers with college degrees are doing better than those without; the economy we’ve built over the past 45 years has been more unequal to some than to others. But below the 90th percentile, even college graduates are falling victim to a decades-long trend of radical inequality that is robbing them of most of the benefits of economic growth.
The iron rule of market economies is that we all do better when we all do better: when workers have more money, businesses have more customers, and hire more workers. Seventy percent of our economy is dependent on consumer spending; the faster and broader real incomes grow, the stronger the demand for the products and services American businesses produce. This is the virtuous cycle through which workers and businesses prospered together in the decades immediately following World War II. But as wages stagnated after 1975, so too did consumer demand; and as demand slowed, so did the economy. A 2014 report from the OECD estimated that rising income inequality knocked as much 9 points off U.S. GDP growth over the previous two decades—a deficit that has surely grown over the past six years as inequality continued to climb. That’s about $2 trillion worth of GDP that’s being frittered away, year after year, through policy choices that intentionally constrain the earning power of American workers.
COVID-19 may have triggered our current crisis, but it wasn’t its only cause. For even had our political leaders done everything right in the moment, our response to the pandemic would still have been mired in the footprint of extreme inequality: a $50 trillion upward redistribution of wealth and income—$297,000 per household—that has left our families, our economy, and our democracy far less capable of fighting this virus than in other advanced nations. This is the America that stumbled into the COVID-19 pandemic and the economic catastrophe it unleashed: An America with an economy $2 trillion smaller and a workforce $2.5 trillion a year poorer than they otherwise would be had inequality held constant since 1975. This is an America in which 47 percent of renters are cost burdened, in which 40 percent of households can’t cover a $400 emergency expense, in which half of Americans over age 55 have no retirement savings at all. This is an America in which 28 million have no health insurance, and in which 44 million underinsured Americans can’t afford the deductibles or copays to use the insurance they have. This is an America that recklessly rushed to reopen its economy in the midst of a deadly pandemic because businesses were too fragile to survive an extended closure and workers too powerless and impoverished to defy the call back to work.
There are some who blame the current plight of working Americans on structural changes in the underlying economy—on automation, and especially on globalization. According to this popular narrative, the lower wages of the past 40 years were the unfortunate but necessary price of keeping American businesses competitive in an increasingly cutthroat global market. But in fact, the $50 trillion transfer of wealth the RAND report documents has occurred entirely within the American economy, not between it and its trading partners. No, this upward redistribution of income, wealth, and power wasn’t inevitable; it was a choice—a direct result of the trickle-down policies we chose to implement since 1975.
We chose to cut taxes on billionaires and to deregulate the financial industry. We chose to allow CEOs to manipulate share prices through stock buybacks, and to lavishly reward themselves with the proceeds. We chose to permit giant corporations, through mergers and acquisitions, to accumulate the vast monopoly power necessary to dictate both prices charged and wages paid. We chose to erode the minimum wage and the overtime threshold and the bargaining power of labor. For four decades, we chose to elect political leaders who put the material interests of the rich and powerful above those of the American people.
Other nations are suffering less from COVID-19 because they made better choices, and the good news is that America can, too. Economics is a choice. We could choose to raise the federal minimum wage to $15 or $20 an hour and peg it to productivity growth like in the decades before 1975. We could choose to revalue work so that the majority of Americans once again earn time-and-a-half pay for every hour worked over 40 hours a week. We could choose to provide affordable high-quality healthcare, childcare, and education to all Americans, while modernizing our social insurance and retirement systems so that contract and gig workers aren’t left out and left behind. We could choose to make it easier for workers to organize, and to defend the rights and interests of those who can’t. We could choose to build a more equitable, resilient, and prosperous America—an America that grows its economy by intentionally including every American in it. But given our nation’s radical redistribution of wealth and power these past 40 years, it won’t be easy.
What American workers need are multiple simultaneous experiments in rebuilding worker power, from tweaking existing labor laws to sectoral bargaining to the creation of whole new trade associations and broad-based not-for-profit organizations. For example, imagine an AARP for all working Americans, relentlessly dedicated to both raising wages and reducing the cost of thriving—a mass membership organization so large and so powerful that our political leaders won’t dare to look the other way. Only then, by matching power with power, can we clear a path to enacting the laws and policies necessary to ensure that that trickle-down economics never threatens our health, safety, and welfare again.
There is little evidence that the current administration has any interest in dealing with this crisis. Our hope is that a Biden administration would be historically bold. But make no mistake that both our political and economic systems will collapse absent solutions that scale to the enormous size of the problem. The central goal of our nation’s economic policy must be nothing less than the doubling of median income. We must dramatically narrow inequality between distributions while eliminating racial and gender inequalities within them. This is the standard to which we should hold leaders from both parties. To advocate for anything less would be cowardly or dishonest or both.
More Must-Reads from TIME
- Inside Elon Musk’s War on Washington
- Meet the 2025 Women of the Year
- The Harsh Truth About Disability Inclusion
- Why Do More Young Adults Have Cancer?
- Colman Domingo Leads With Radical Love
- How to Get Better at Doing Things Alone
- Cecily Strong on Goober the Clown
- Column: The Rise of America’s Broligarchy
Contact us at letters@time.com