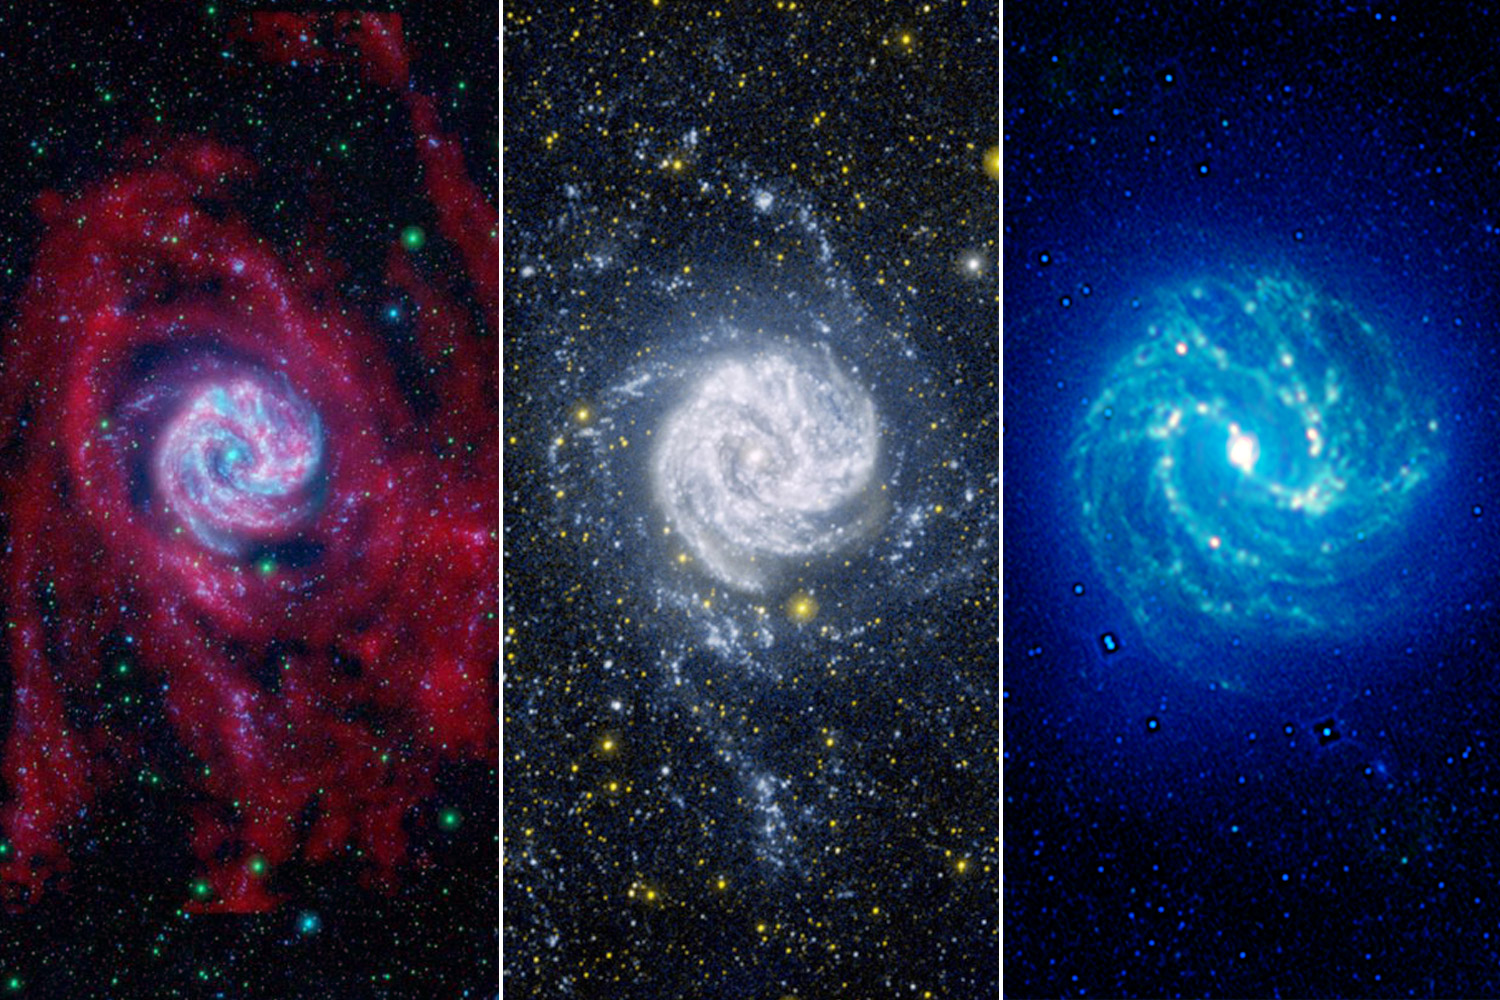
The image above might look like something many Americans will see at a 4th of July fireworks display. They depict a single galaxy, named the Southern Pinwheel Galaxy, or Messier 83, processed in red, white, and blue. What is the significance of these colors?
In the case of the American flag, the colors were originally not assigned any meaning at all and perhaps were chosen simply to mimic the colors of the British flag. It was only later, when the country adopted an official U.S. seal, that the colors were assigned meaning. “White signifies purity and innocence. Red, hardiness and valour, and Blue… signifies vigilance, perseverance & justice,” declared Charles Thomson, Secretary of the Continental Congress in 1782.
Those who process astronomical images, which are almost always black and white in their raw form, also face the decision of assigning meaning to colors. Sometimes, images are processed with an eye for artistry and aesthetic appeal, as in many of the beautiful, rainbow-tinged images from the Hubble Space Telescope.
More often, color is used to reveal a particular feature of an astronomical object, as the Hubble Telescope’s site explains. Depending on the instruments used to capture the images, an image might be composed of visible light, as human eyes can see, or any variety of the wavelengths of light which are invisible to us, such as infrared or x-rays. Standard practice is to assign colors based on “chromatic order,” meaning that the lowest wavelength captured should be given a blue hue, the middle wavelength a green hue and the highest wavelength a red hue.
There is an enormous variety of astronomical images out there, from the grainiest black and white images, to the most spectacular, dramatic, showstoppers. Each of them has something different it can tell us about the universe.
Southern Pinwheel Galaxy (Messier 83)
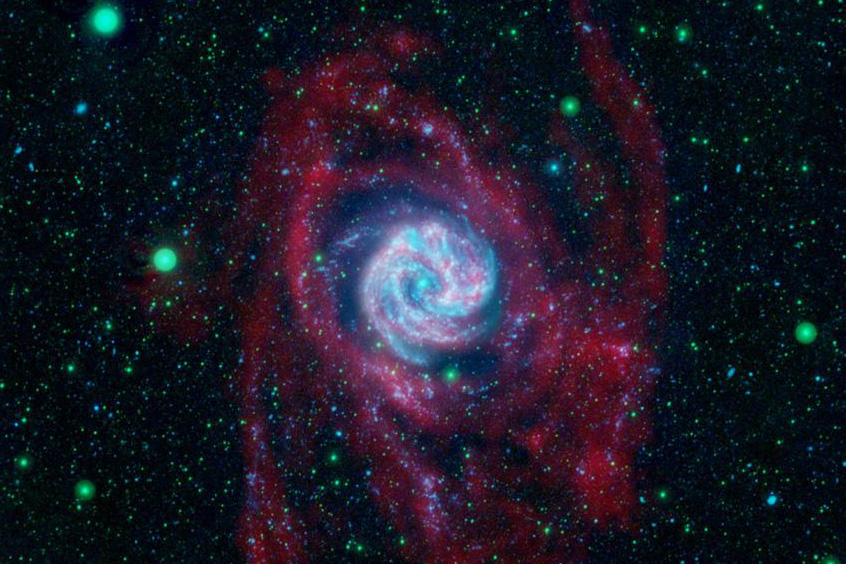
The Very Large Array measures radio emissions, represented here by red, which highlights the galaxy’s long arms.
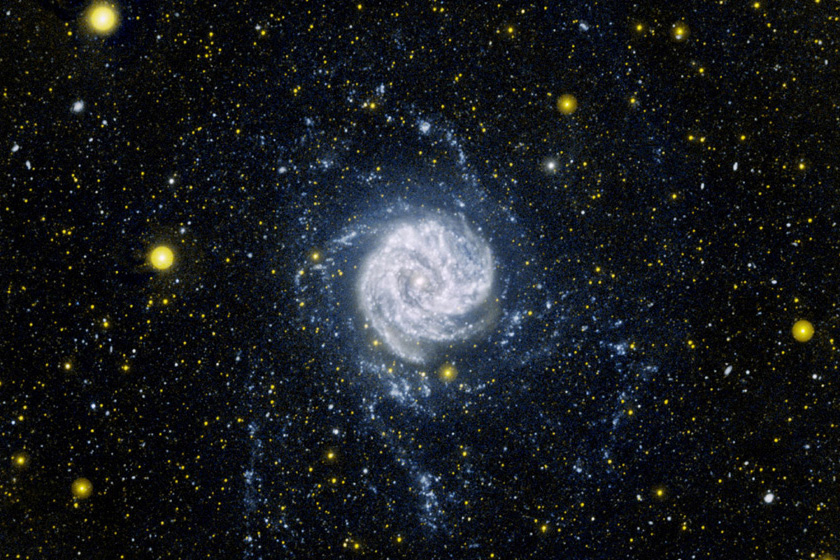
The GALEX Telescope measures ultraviolet light, represented here by a blue-ish white, which reveals clusters of baby stars within the arms.
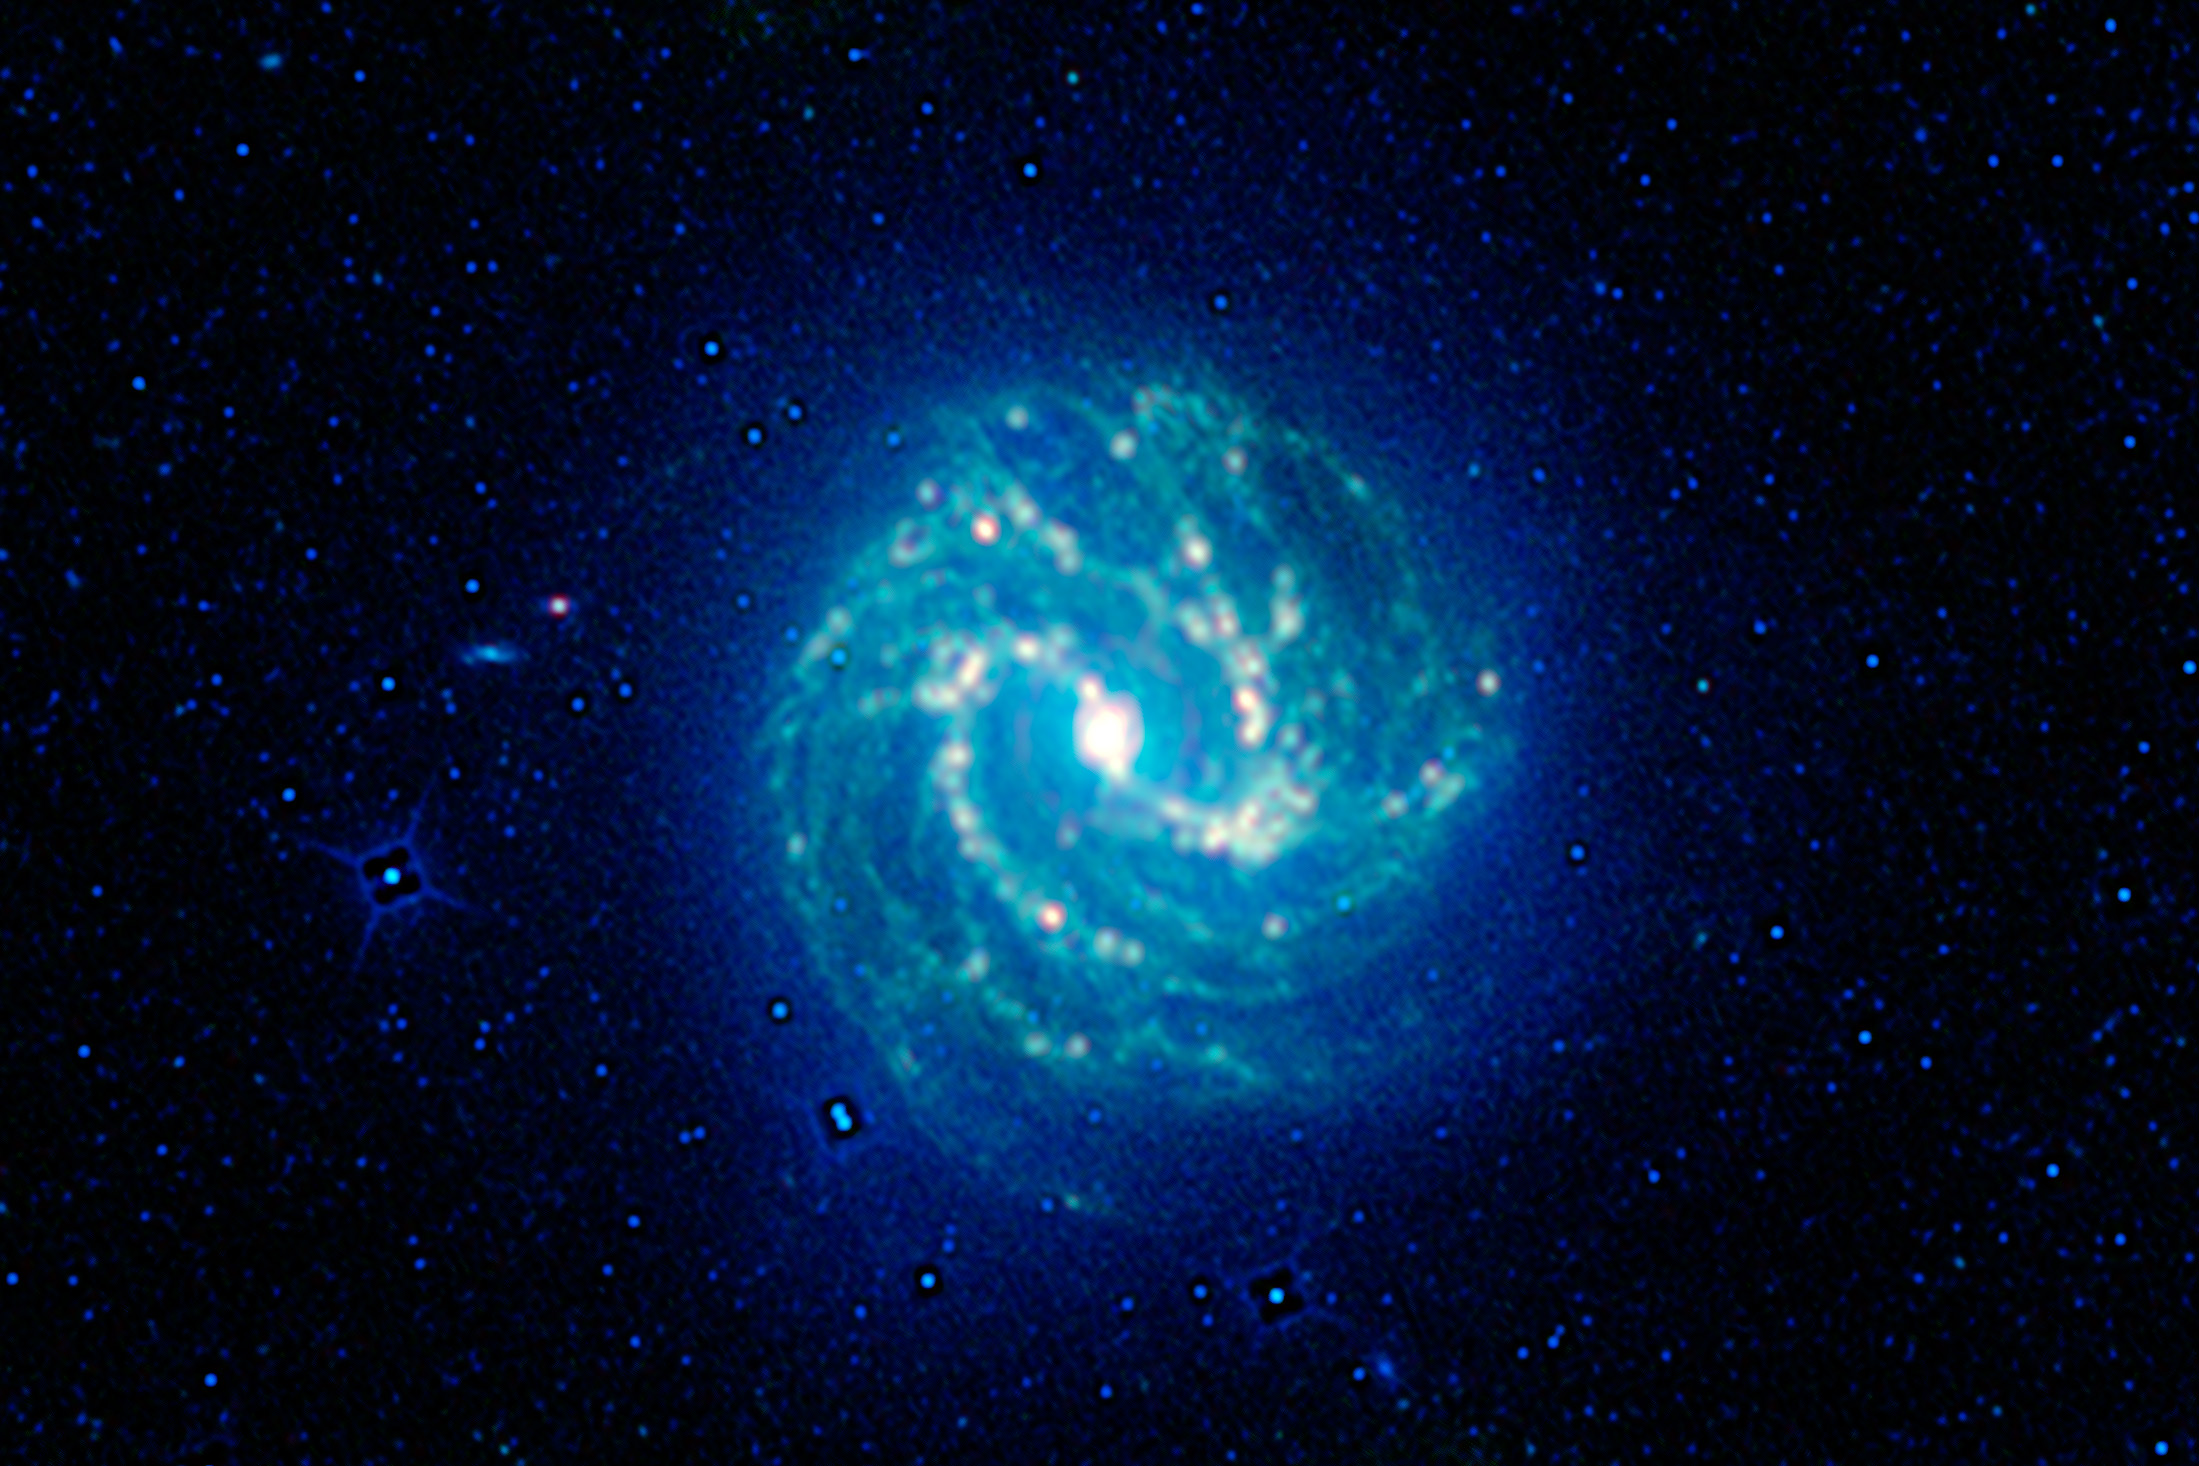
The Wide-field Infrared Survey Explorer, or WISE, translates infrared light as bright blue. In its images, older stars appear blue, while newer stars take on a yellow or reddish hue.
Jupiter
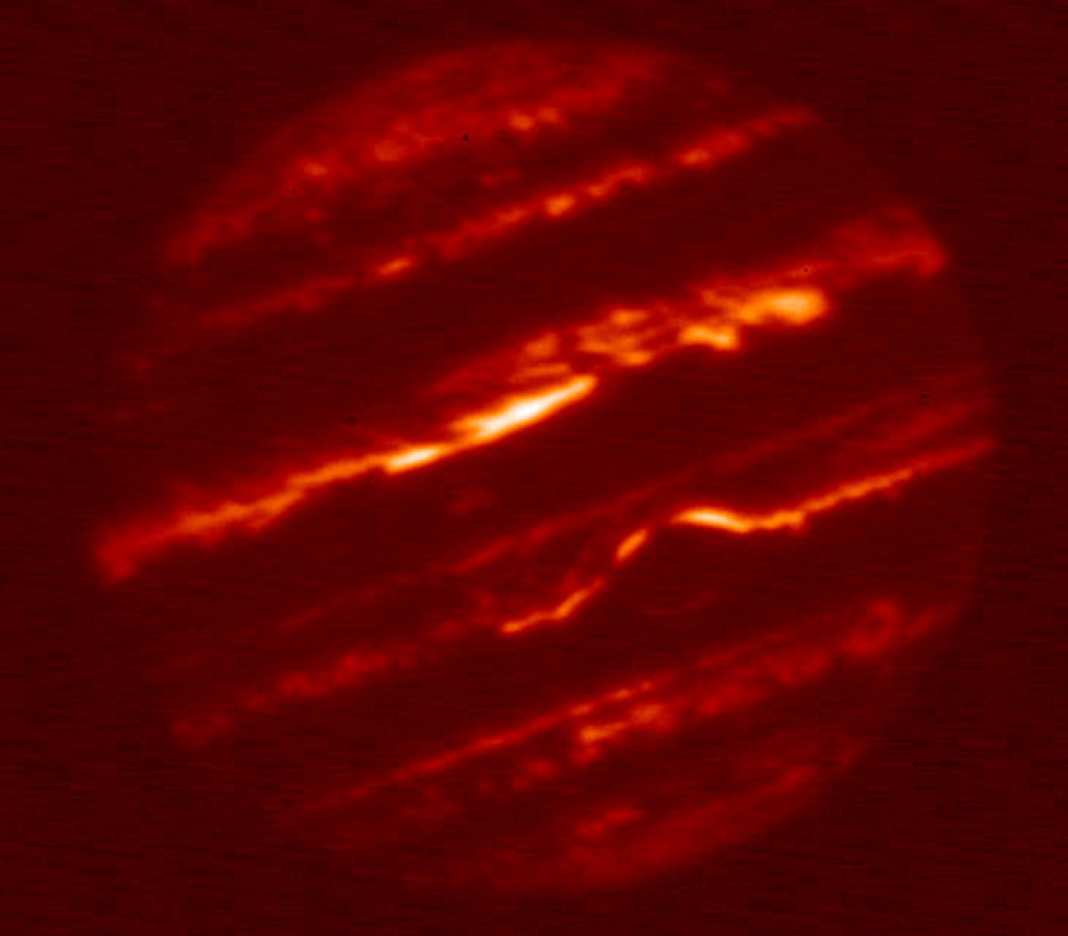
The InfraRed Telescope Facility captured this fiery image of Jupiter. An animated version of this image (here) shows how the planet’s features move and change over time.
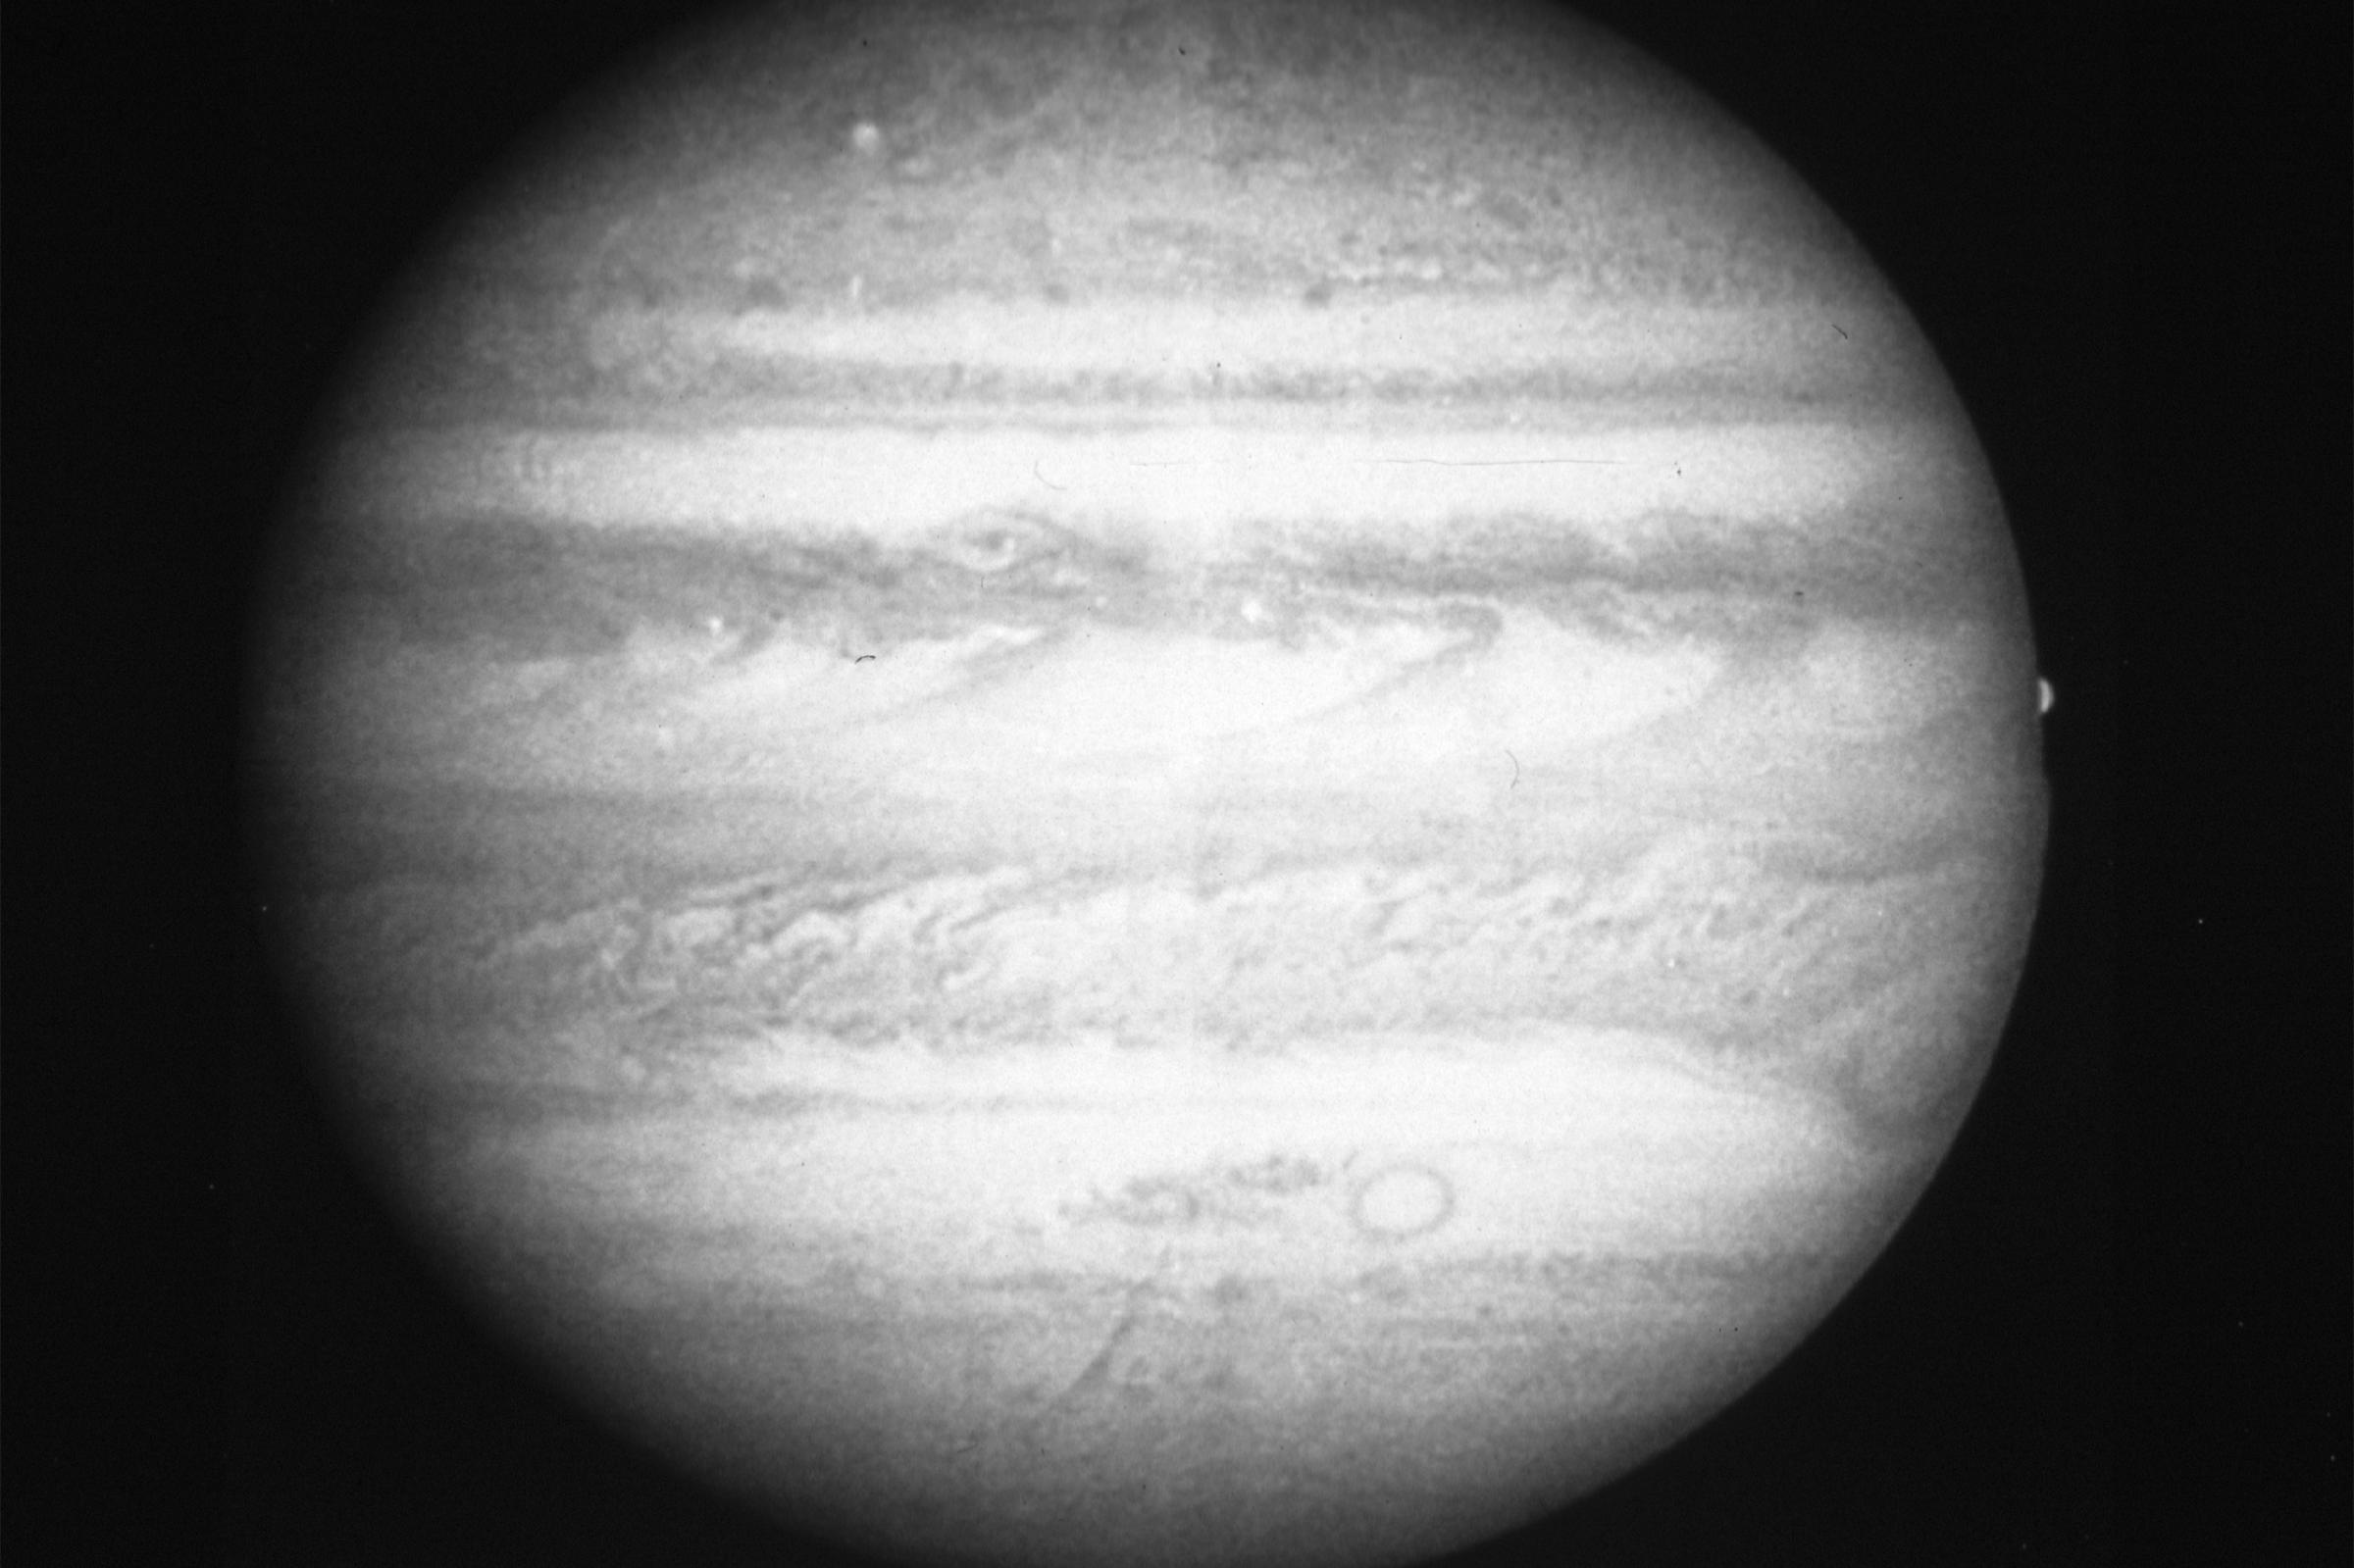
The Hubble Space Telescope’s Planetary Camera captured this black and white view of Jupiter in 1991. It shows the fine detail in the clouds that cover the planet. Comparison with images taken by Voyager in the 1970’s reveals changes in Jupiter’s weather.
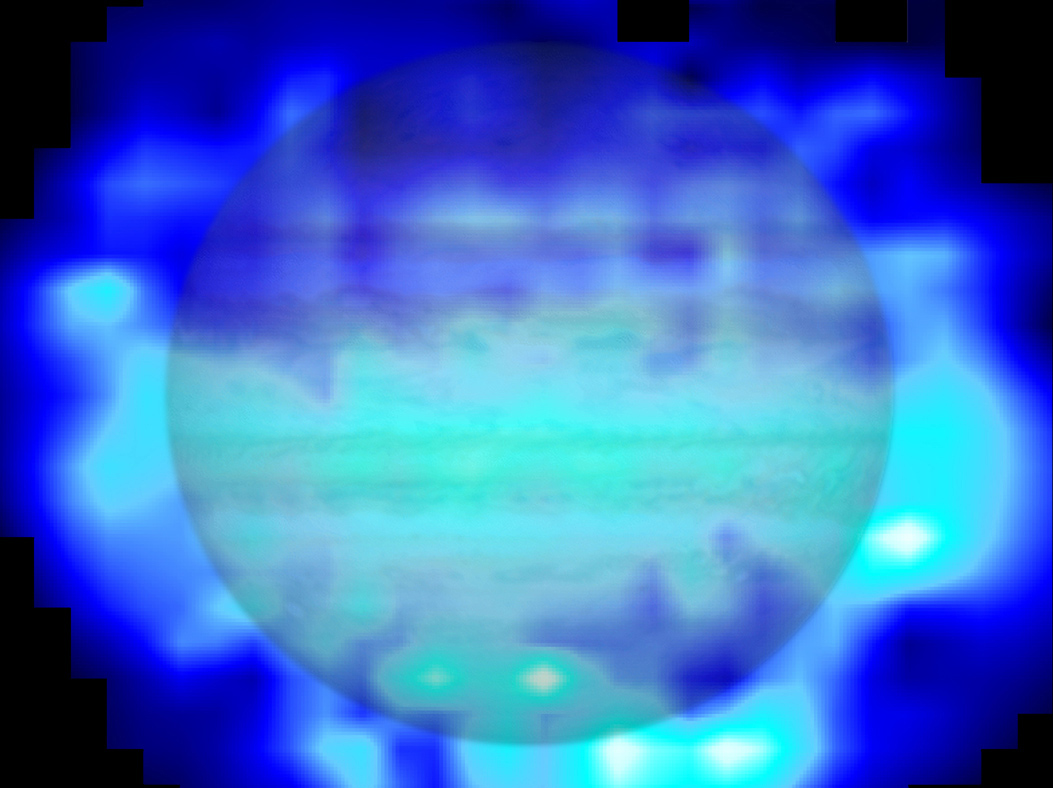
The blue in this image is actually a water distribution map, superimposed over a visible wavelength image of Jupiter. Lighter colors of blue indicate higher concentrations of water in the planet’s stratosphere. It reveals that water is concentrated over the southern hemisphere, providing evidence that most of the water in this layer of Jupiter’s atmosphere was supplied by a comet, Shoemaker-Levy 9, which crashed into the planet’s southern hemisphere in 1991.
Galaxy NGC 1512
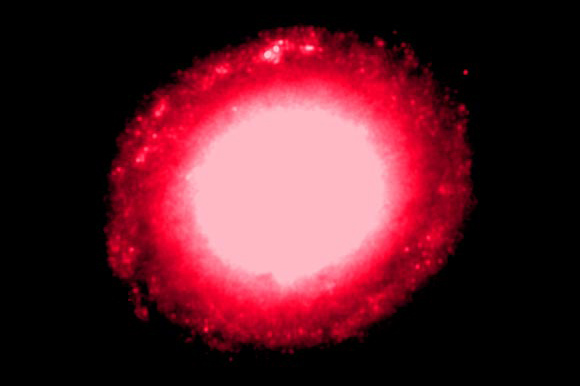
This barred spiral galaxy is a neighbor of our own, the Milky Way. The infrared wavelengths shown in this image taken by the Hubble Space Telescope, “reveals gas clouds illuminated by radiation from hidden clusters of young stars.”
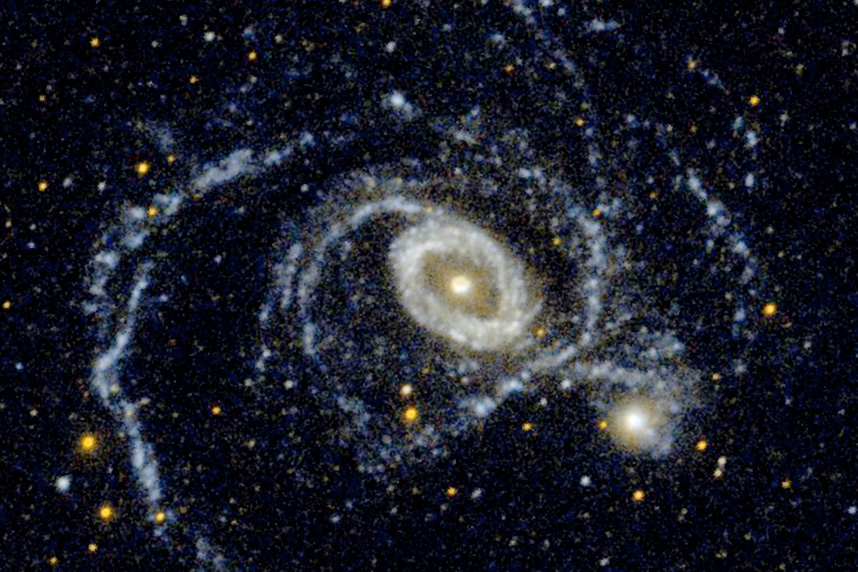
White, in this GALEX image, represents ultraviolet light. It shows how the spiral arms of the galaxy are distorted due to gravitational interactions with a neighboring galaxy, NGC 1510. Golden areas indicate regions that are obscured by dust particles.
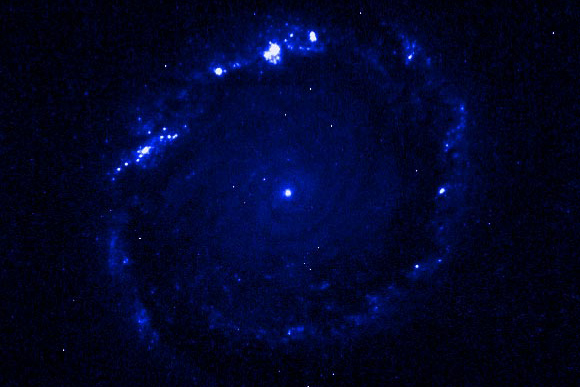
This vivid blue image, like the red image above, was also captured by Hubble. It reveals bright star clusters in ultraviolet, while the gas clouds, which were so prominent in the infrared image, fade into the background.
Sun
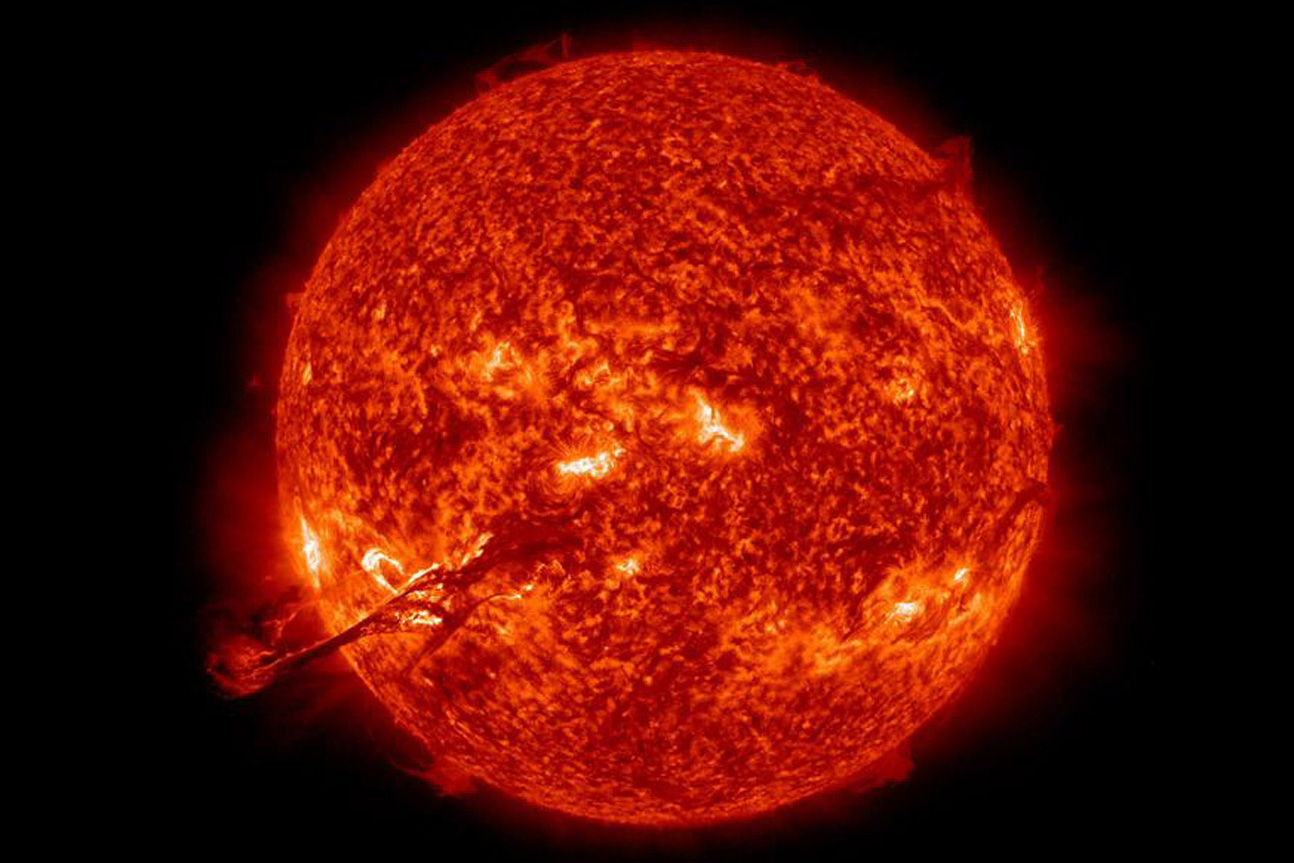
In August, 2012, the Solar Dynamics Observatory caught this dramatic eruption in extreme ultraviolet light. This type of light, emitted by stars, is color coded according to Angstroms, which is a measurement for wavelengths of light. This image is in the 304 Angstrom wavelength, which is traditionally processed as a bright, fiery orange or red.
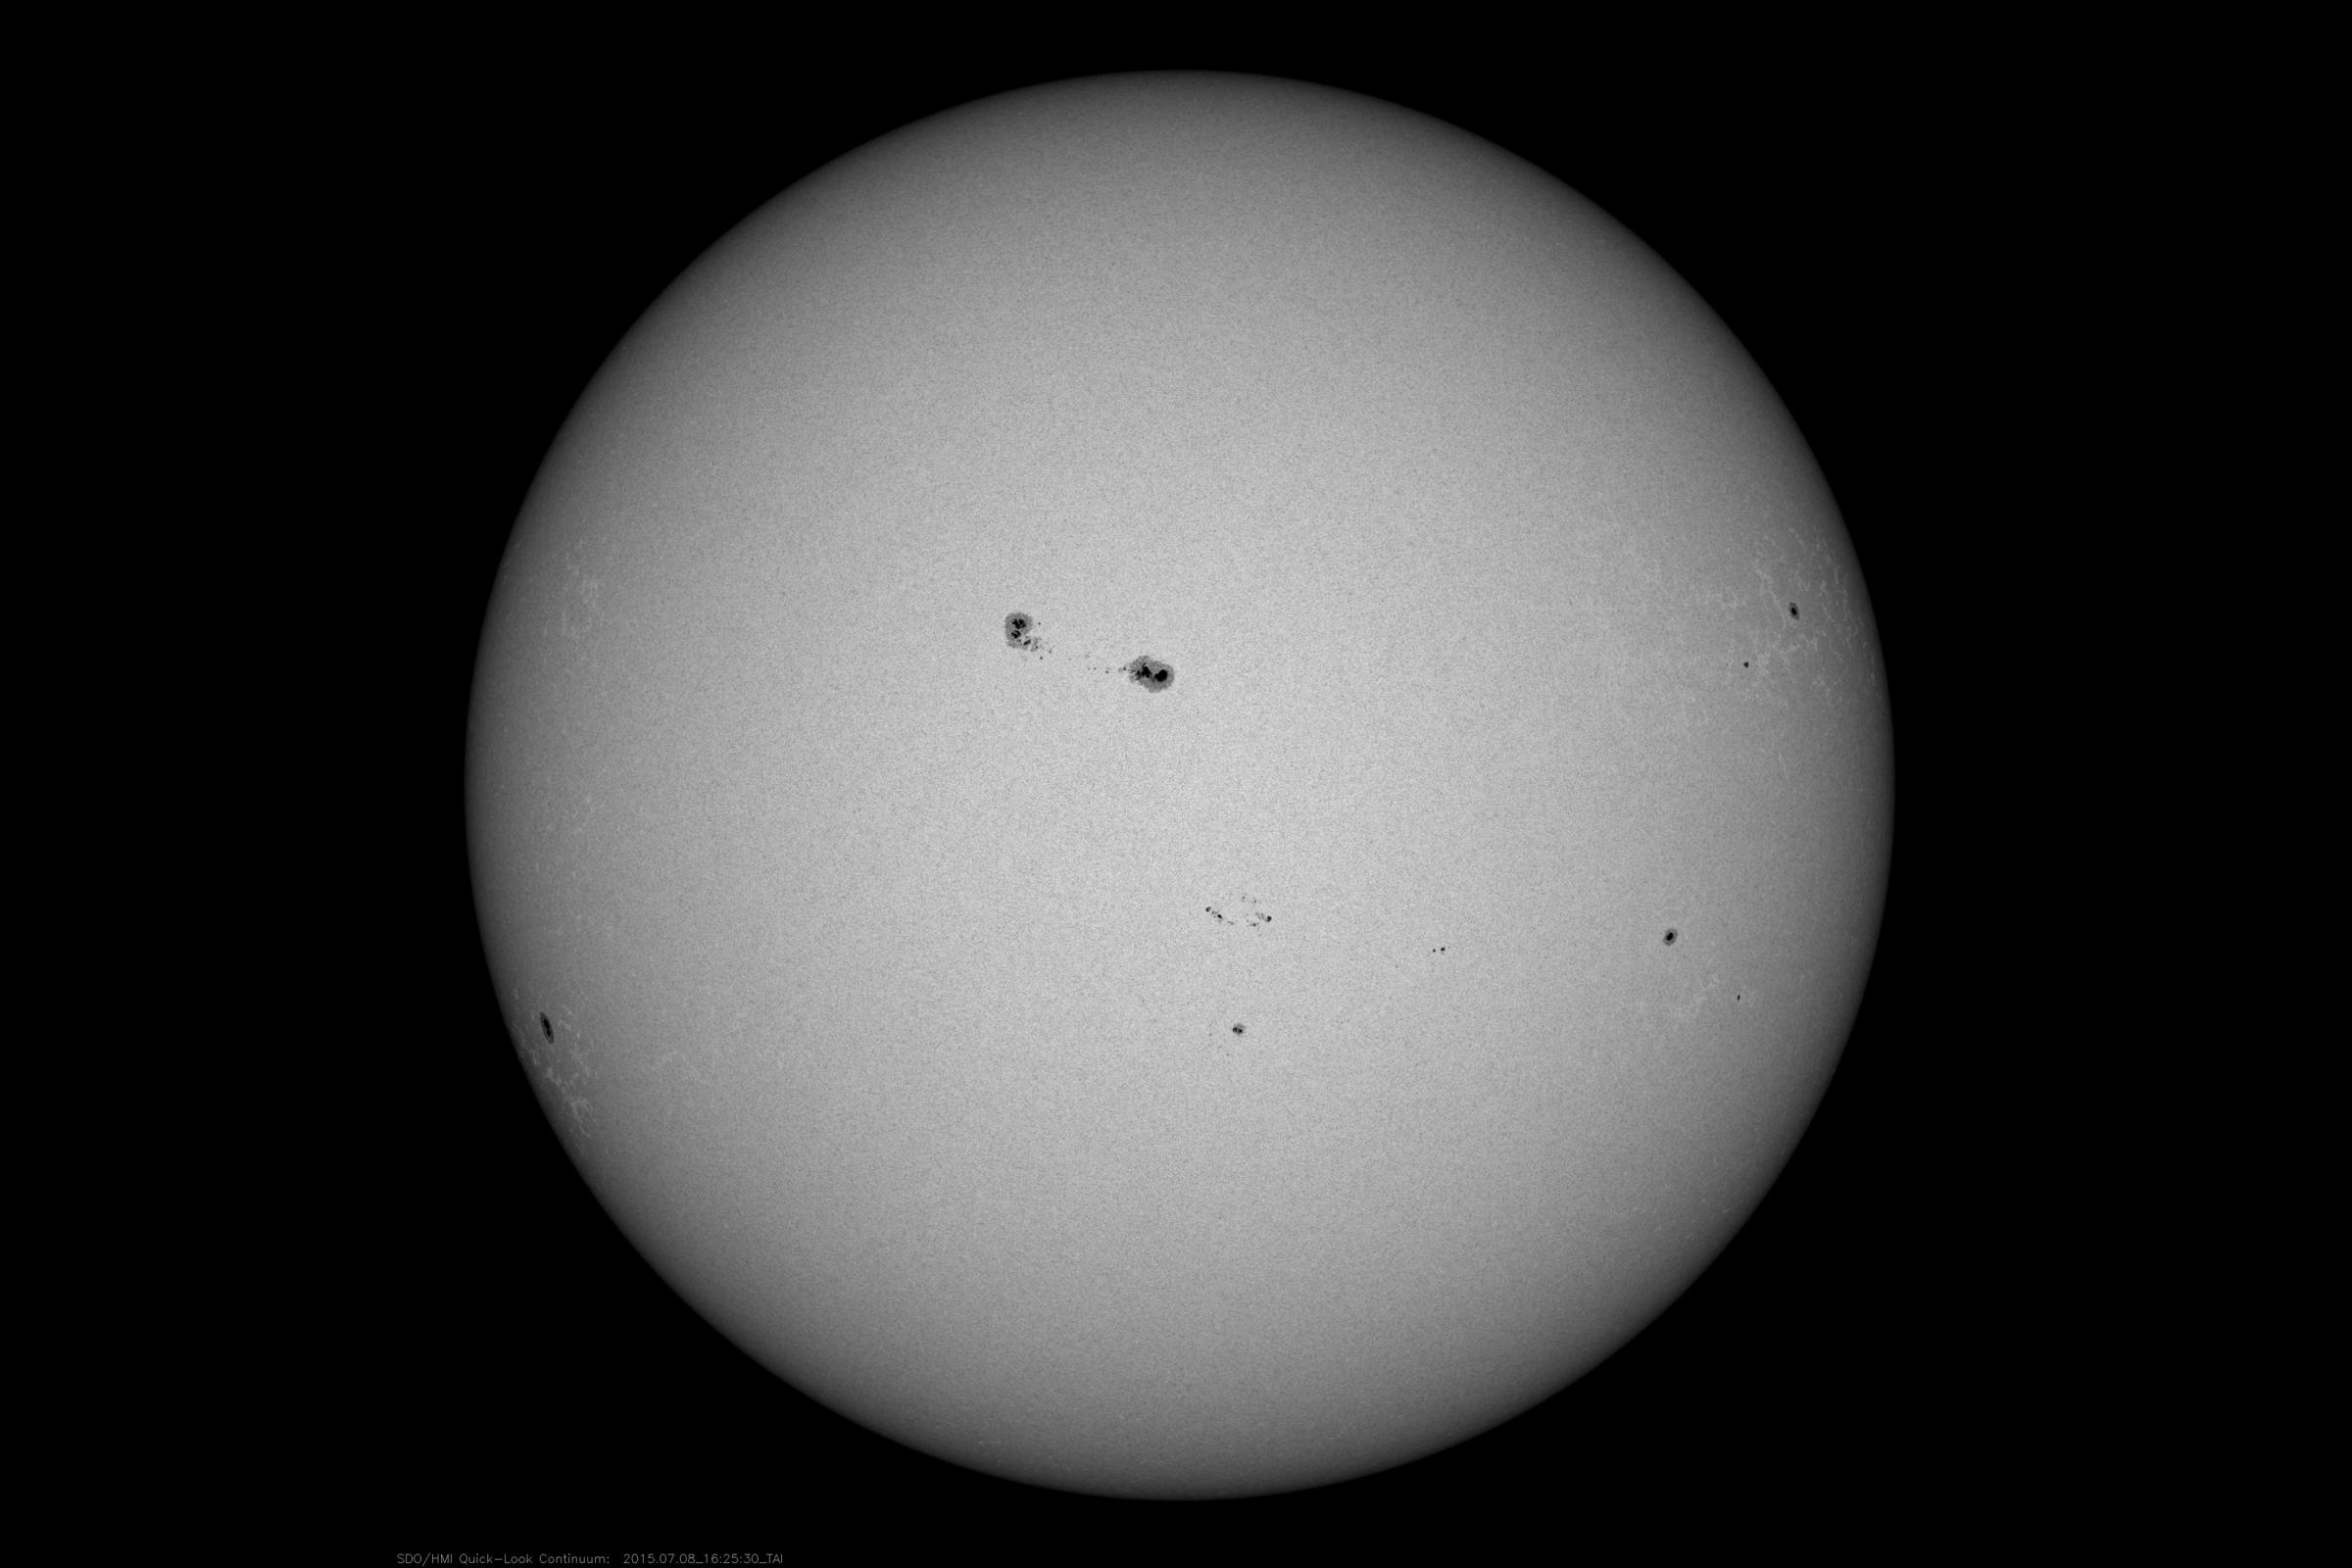
Filtered light images, or intensitygrams, are used to show the location of sunspots. Sunspots, which are generated by magnetic forces, are darker and cooler than the rest of the sun’s surface.
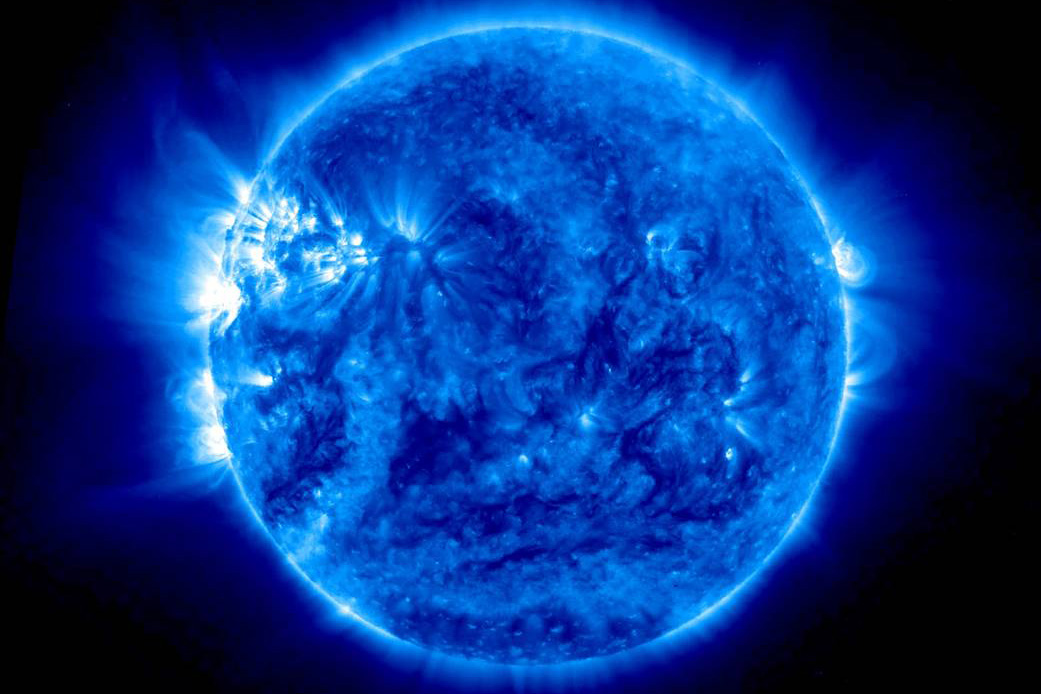
NASA’s STEREO-A spacecraft captures image in several wavelengths that are invisible to the human eye. This blue image comes from its Extreme Ultraviolet Imager. At 171 Angstroms, it is colorized to a deep blue.
More Must-Reads from TIME
- Cybersecurity Experts Are Sounding the Alarm on DOGE
- Meet the 2025 Women of the Year
- The Harsh Truth About Disability Inclusion
- Why Do More Young Adults Have Cancer?
- Colman Domingo Leads With Radical Love
- How to Get Better at Doing Things Alone
- Michelle Zauner Stares Down the Darkness
Contact us at letters@time.com