By Jack Linshi
The New York Stock Exchange (NYSE) suspended all trades Wednesday because of a technical problem that remains unsolved as of early Wednesday afternoon. But what did that suspension actually look like?
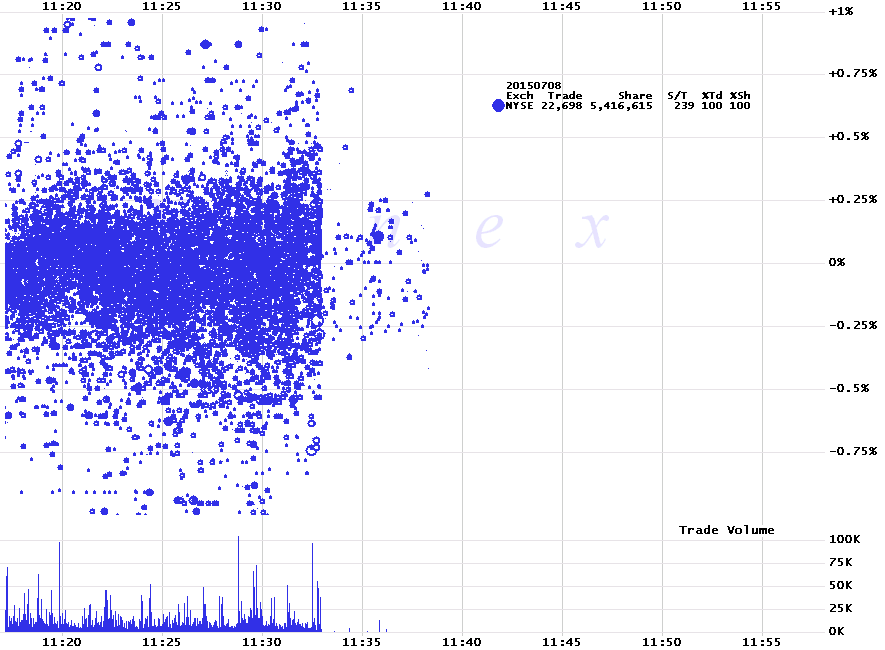
Some traders saw the market eerily stop in a chart similar to the one above, which was created by Eric Scott Hunsader of Nanex, a real-time market transaction data firm. Hunsader said the trades — each one represented by a blue dot — dropped at 11:32:57 a.m. ET before sputtering for a few minutes and then halting altogether.
All NYSE trading remained halted as of early Wednesday afternoon. The NYSE said the issue arose from an “internal technical issue” and “is not the result of a cyber breach.”
More Must-Reads from TIME
- Why Biden Dropped Out
- Ukraine’s Plan to Survive Trump
- The Rise of a New Kind of Parenting Guru
- The Chaos and Commotion of the RNC in Photos
- Why We All Have a Stake in Twisters’ Success
- 8 Eating Habits That Actually Improve Your Sleep
- Welcome to the Noah Lyles Olympics
- Get Our Paris Olympics Newsletter in Your Inbox
Contact us at letters@time.com