 flag")
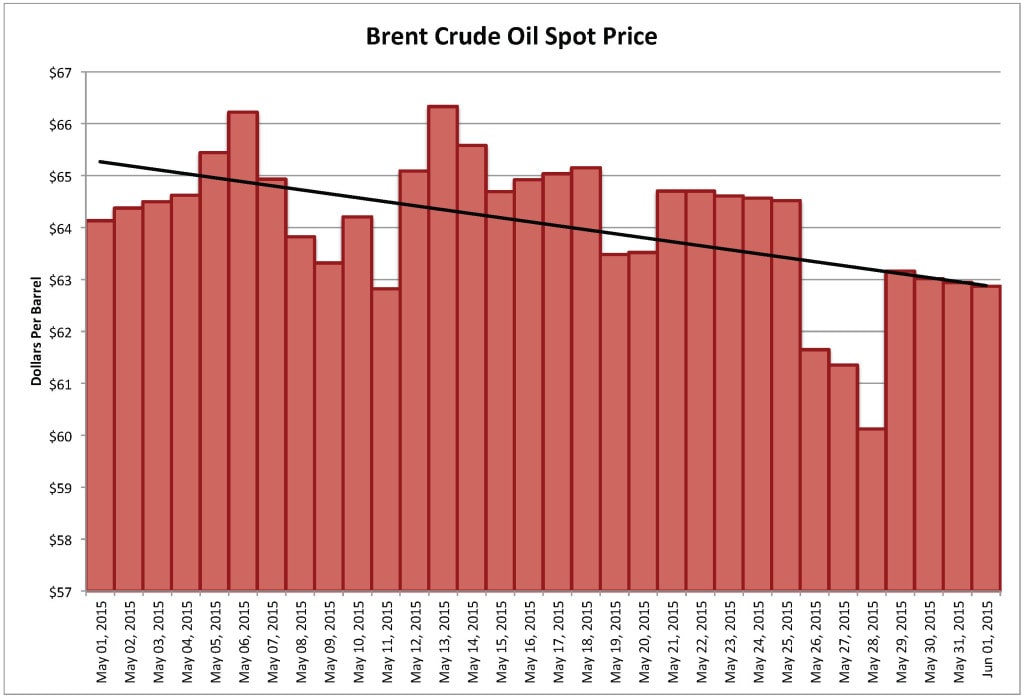
Following OPEC’s decision not to cut production at its June 5, 2015 meeting in Vienna, oil prices should likely continue their descent that began in early May (Figure 1). Prices may fall into the $50+ per barrel range since there is no tangible reason for their rise from January’s $46 low.
Saudi Arabia’s longer view of demand and market share dominated the decision not to cut.
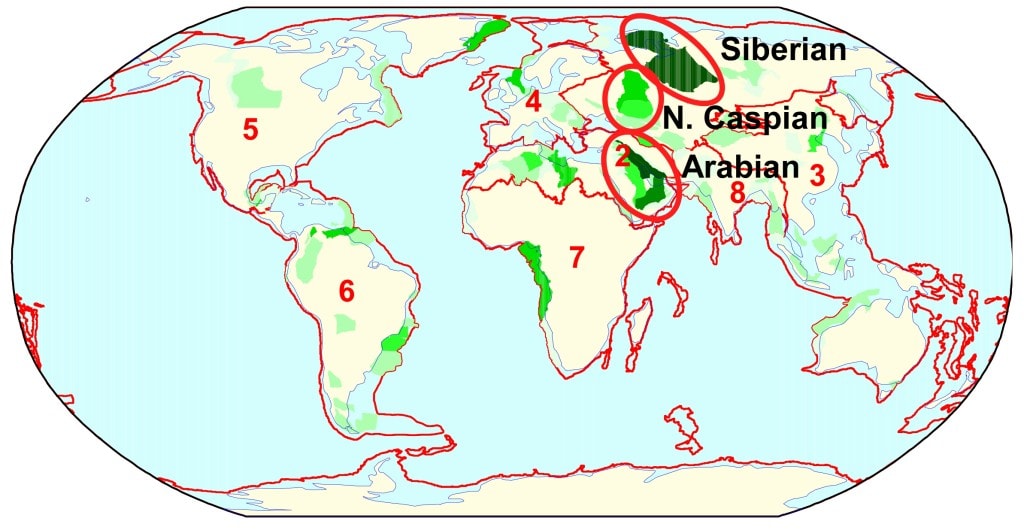
World oil production has undergone a structural shift from supply dominated by relatively inexpensive conventional production to increasingly more supply coming from expensive deep-water and unconventional production. Most conventional oil is located in the Arabian, Siberian and North Caspian basins (Figure 2) while deep-water and unconventional production is focused along the margins of the Atlantic Ocean and in North America.
This shift is at the root of the current price conflict between OPEC and North American oil producers. Since 2008, OPEC liquids production has been fairly flat until mid-2014 (Figure 3). Non-OPEC production outside of North America has been flat. Most production growth has occurred in the U.S. and Canada but it is not only from tight oil.
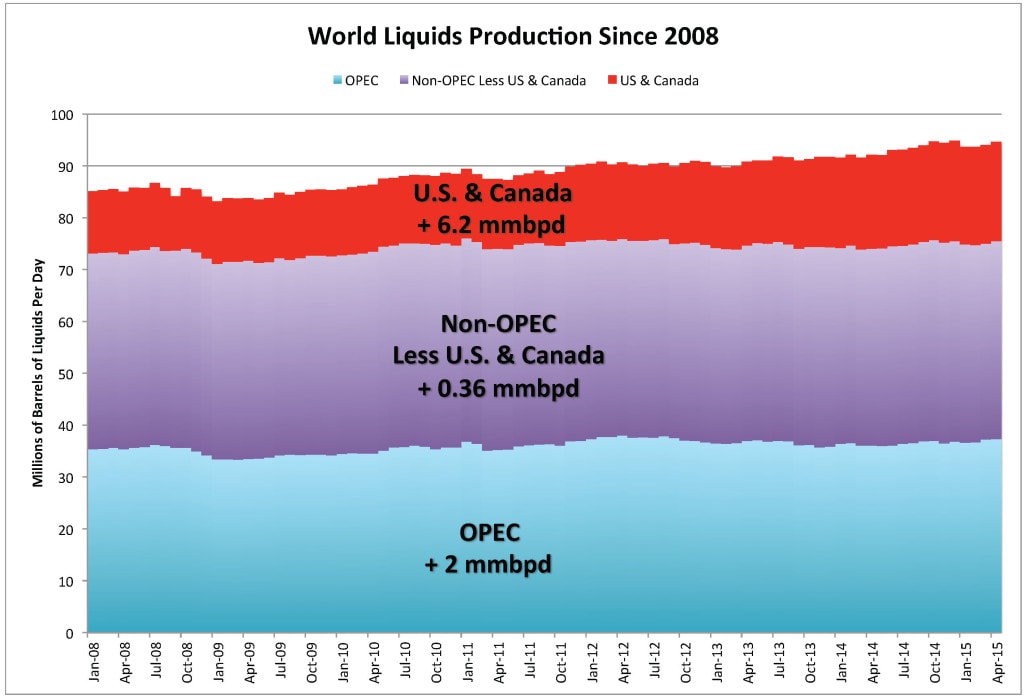
The competition for OPEC market share is from Canadian oil sands, Gulf of Mexico deep-water and tight oil production. U.S. plus Canadian production has increased 6.2 million barrels per day (mmbpd) since January 2008. OPEC production has increased 2 mmbpd over that period with 1.3 mmbpd (65%) of that increase since June 2014.
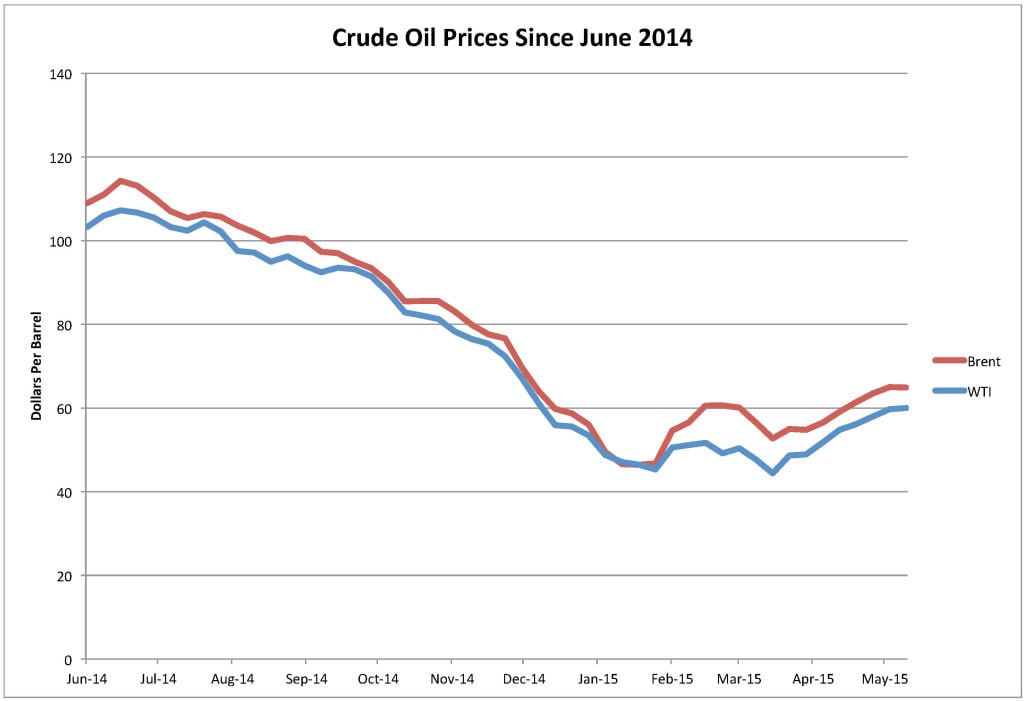
Lower oil prices over the past year (Figure 4) have not yet resulted in any observable decrease in North American production. Higher prices over the last few months further complicate the situation for OPEC. The global production surplus has gotten worse, not better, in recent months but prices rose based on sentiment.
It is true that U.S. production may be falling but a 3-month lag in reporting prevents us from seeing this. It is also true that OPEC may have limited capacity to increase their production further although Middle East rig counts have never been higher.
The only way for OPEC to significantly increase its market share is to undermine North American expensive oil production with low oil prices for at least another 6 months. This is why a production cut at this time made little sense to them.
This article originally appeared on Oilprice.com.
More from Oilprice.com:
More Must-Reads From TIME
- The 100 Most Influential People of 2024
- Coco Gauff Is Playing for Herself Now
- Scenes From Pro-Palestinian Encampments Across U.S. Universities
- 6 Compliments That Land Every Time
- If You're Dating Right Now , You're Brave: Column
- The AI That Could Heal a Divided Internet
- Fallout Is a Brilliant Model for the Future of Video Game Adaptations
- Want Weekly Recs on What to Watch, Read, and More? Sign Up for Worth Your Time
Contact us at letters@time.com