For baseball fans who do not follow off-season intrigue, Opening Day can feel a lot like the first day of school. Who’s that new kid at third base? And what happened to that guy who used to play left field?
On average, teams replace between three and four players in their Opening Day lineup each season. (3.6, to be exact.) But that figure varies widely from team to team and season to season. Of the 1,434 Opening Day lineups that TIME examined going back to 1960, 23 teams have kept the exact lineup from one season to the next, while 24 teams have swapped out eight or more of their previous season’s starters. (To be fair, that latter number includes the first season of expansion teams, who naturally have all new players.)
Here’s a quick picture of how much a team’s Opening Day lineup changes from year to year, going back to the 1960 season.
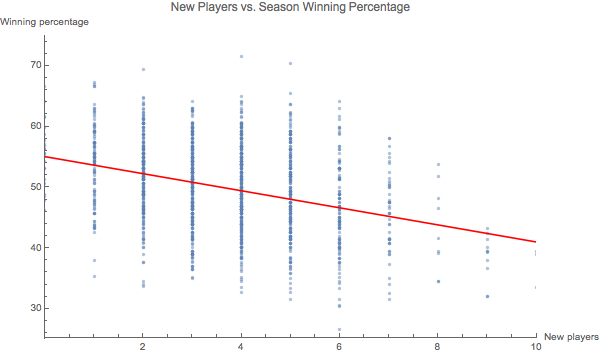
Changes to lineups, while often unavoidable, are decidedly bad for a team’s immediate outlook. There is clear correlation between the number of new players in an Opening Day lineup and the team’s winning percentage for that season.
See where your team falls on this curve by clicking or tapping the logo:
Lest you see a lot of new faces on your team and give up hope, there is a huge amount of variation in the data, and new faces can be a bonus for a stagnating team. Just ask the Dodgers, whose new shortstop, the veteran Jimmy Rollins, hit a clutch three-run homer yesterday to power them past the Padres.
For one thing, these charts measure the number of new faces on the Opening Day roster, which can include veteran pitchers like the Red Sox’s Clay Buchholz who finally moved to the top of the rotation. And plenty of teams with a turnover of six or more players have had successful seasons. It’s just less likely. It turns out there is, in fact, a lot of truth to the notion of a rebuilding year.
Methodology
A player’s appearance on an Opening Day roster is counted independent of what position he played, so players who move around the diamond are not counted as new faces. Players traded from one team to another do count as new, so a player making his first Opening Day appearance with a team is not necessarily a rookie.
The correlation between the number of new players on Opening Day and the team’s winning percentage for the season is -0.34. The distribution of each point is shown here with the line of best fit.

Data comes from Retrosheet.org, Baseball-Reference.com and Major League Baseball. For the portions of the data that come from Retrosheet, the following statement applies: “The information used here was obtained free of charge from and is copyrighted by Retrosheet. Interested parties may contact Retrosheet at www.retrosheet.org.”
More Must-Reads from TIME
- Donald Trump Is TIME's 2024 Person of the Year
- Why We Chose Trump as Person of the Year
- Is Intermittent Fasting Good or Bad for You?
- The 100 Must-Read Books of 2024
- The 20 Best Christmas TV Episodes
- Column: If Optimism Feels Ridiculous Now, Try Hope
- The Future of Climate Action Is Trade Policy
- Merle Bombardieri Is Helping People Make the Baby Decision
Write to Chris Wilson at chris.wilson@time.com