Poll a random sampling of drivers on car preference, and you’ll likely get a mix of responses like the following:
“I’ll never drive an American car again.”
“I don’t trust any automobile made outside of Japan.”
“Once I drove German, I never went back.”
If there’s one thing we humans do well, it’s swearing off entire product categories on the basis of one or two experiences. And why not? That’s every consumer’s privilege.
At FindTheBest, however, we were curious to see what the data would say. Which car stereotypes are backed up by the facts, and which aren’t? We started with 2014 models, compiling information on over 1,500 cars across 36 different manufacturers. We then calculated the average spec, rating or score for each of 10 key data points, with an overall focus on performance, safety, fuel efficiency and size.
Here’s what we found:
Performance
Horsepower
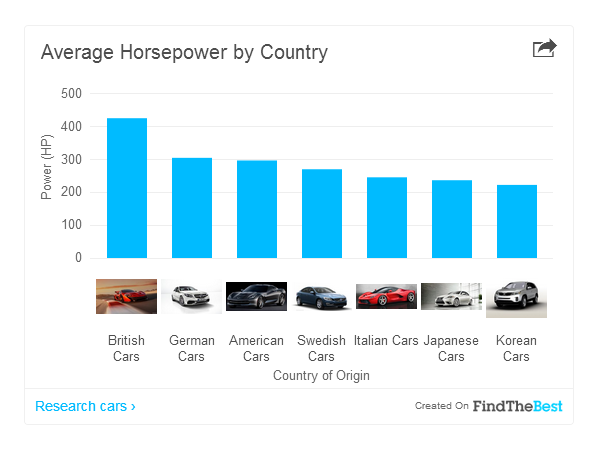
Thanks to a host of high-powered McLarens, Bentleys and Aston Martins, the Brits win round one rather handsomely. Even the mid-powered Land Rover can’t get Britain down. The most surprising loser here is probably Italy, whose Ferrari-Lamborghini-Maserati trifecta can do little to counterbalance the sputtering Fiat line, which drags down the Italian average significantly.
Acceleration (0-60)
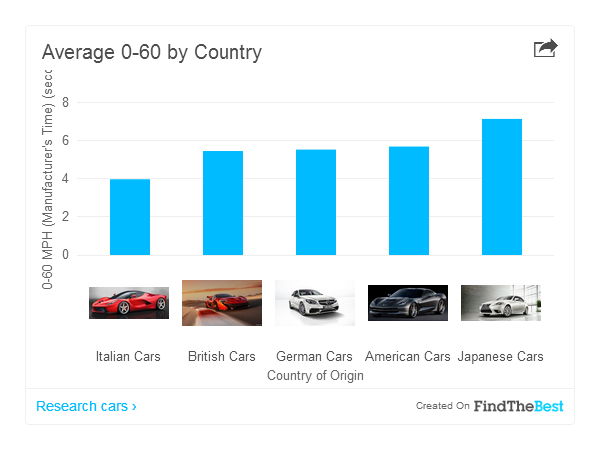
Italy earns the acceleration crown with its 3.9-second 0-60 average, though its win here comes with a Barry Bonds-sized asterisk: slowpoke Fiat does not report 0-60 figures, while Britain’s slowest brand—Land Rover—does. So what if we took out Land Rover as well? Italy still wins, but only by eight-tenths of a second.
Top Speed
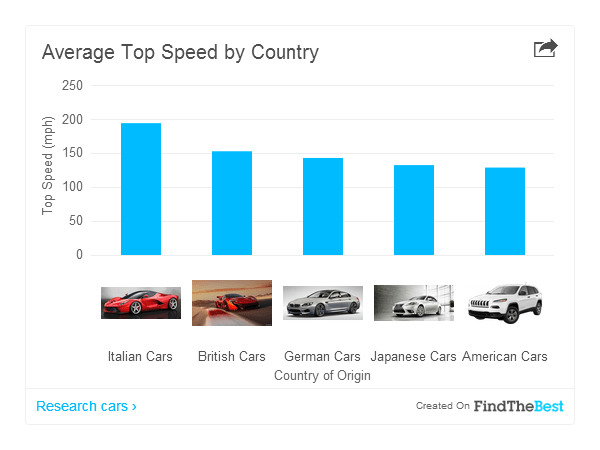
Once again, we see a strong Italian victory, inflated by the fact that Fiat didn’t bother to report top speeds (and in fairness, why should they?). Meanwhile, all those lumbering American trucks keep the U.S. far out of contention.
Towing Capacity
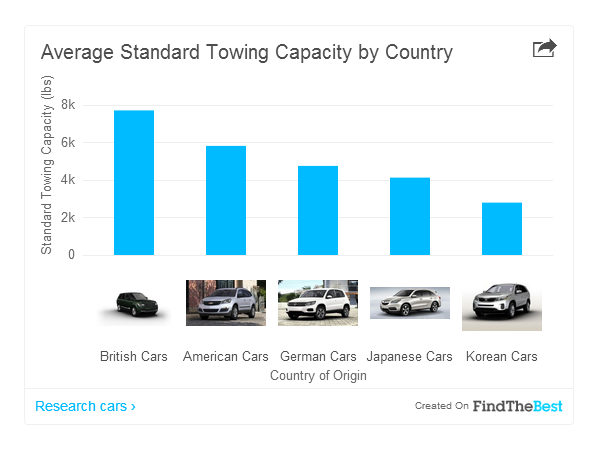
Here, America’s trucks rumble back, towing the USA into second overall. But Britain’s pesky Land Rovers roll in yet again, strong enough to stave off a slew of Fords, Rams and Chevys in a battle of the tow-friendly automobiles.
Note that we only considered towing-equipped vehicles for this category (sorry, Aston Martin), which helps explain Britain’s surprising win. It’s also worth mentioning that American cars easily dominate in sheer volume. In fact, 188 of the top 200 autos in this category were made in the U.S.
Safety
NHTSA Overall Safety Rating
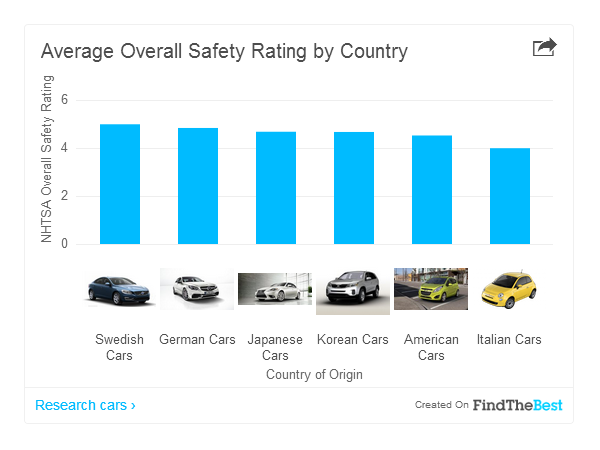
The National Highway Traffic Safety Administration (NHTSA) runs automobiles through a variety of rigorous tests, including frontal crash, side crash and rollover, assigning a score from 1 (high chance of passenger injury) to 5 (low chance of passenger injury). They then provide an overall score out of 5.
Sweden wins here on the strength of Volvo’s safe, sturdy line-up. Meanwhile, the Italians place last—the plight of the small and speedy.
Fuel Efficiency
Gas Mileage (combined)
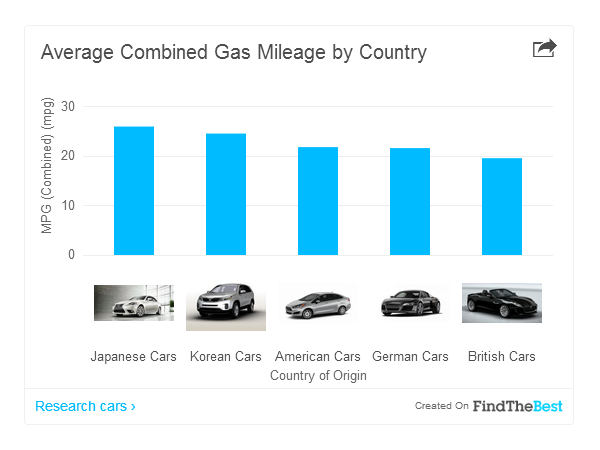
With gas mileage, the efficient Japanese score their first win, narrowly edging out their Korean neighbors. Our calculation was based on the EPA’s combined MPG figure, which assumes 55% city driving and 45% highway driving. Korea actually does a bit better than Japan if you focus exclusively on highway MPG.
(We left out Italy because we didn’t have a big enough sample size of reliable gas mileage figures.)
Size
Seating Capacity
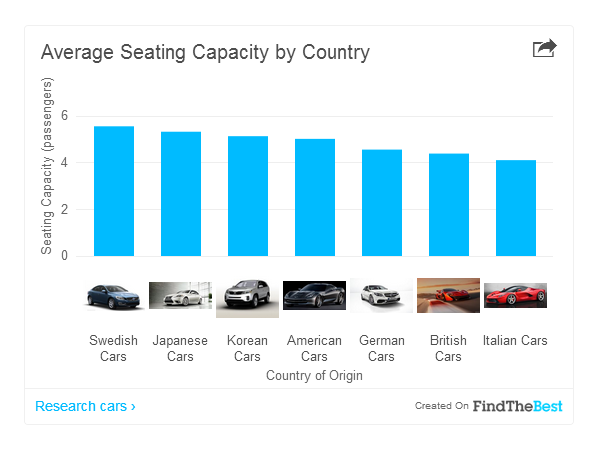
The average Swedish car has nearly six seats, big enough to beat out the rest of the world in size. That said, if you want a giant car, you might as well still shop American, as 33 of 2014’s 50 largest cars were made in the U.S.
Overall Weight
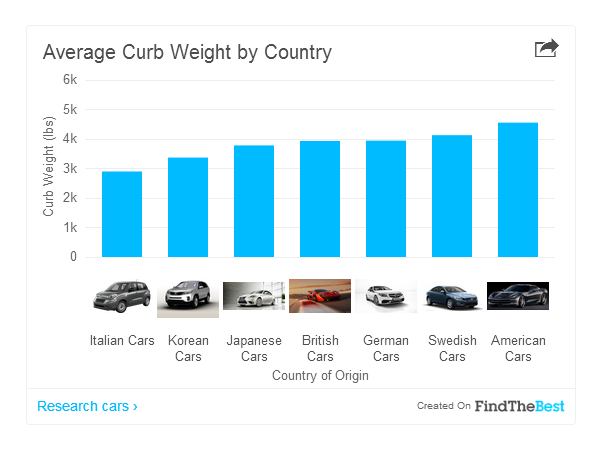
Forget about seating capacity. What about raw weight? The standard measurement in the industry is “curb weight”—it includes any necessary components for operating the car (i.e. fuel), though it does not include any passengers or cargo.
America finally snags an outright win, barreling past Germany and Sweden on its way to heaviest in the world.* The Italians might be nimble, but fittingly, the U.S. remains the champion of girth.
* Though, naturally, this depends on whether you believe a bigger car is better.
Price
MSRP
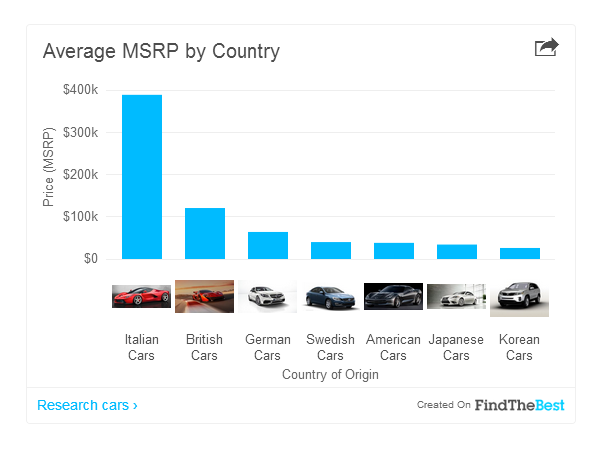
Thanks largely to a couple of insanely priced autos (we’re looking at you, Lamborghini Veneno and Ferrari LaFerrari), Italy’s average cost per car is over three times that of its closest competitor (Britain). (For numbers geeks, Italy wins easily on median MSRP as well, with a $192,000 price tag next to Britain’s $93,000.)
Ratings
Smart Rating
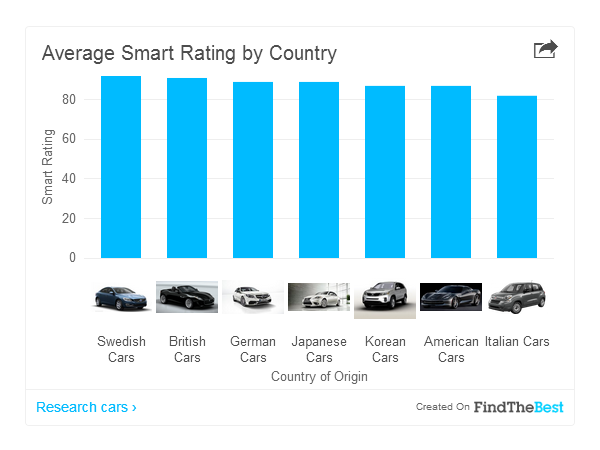
Finally, we calculated a Smart Rating, which combines expert awards (73%), safety (18%), and value over time (9%) for every car on the list. Experts included North American Car of the Year, Popular Mechanics, The Car Connection, Motor Trend, Cars.com, Automobile Magazine, Car and Driver, and About.com Best New Cars.
The big winner? Sweden. The Swedes ride Volvo’s solid, consistent line-up past a multi-tiered assault of luxury cars from Britain and classic favorites from Germany. Meanwhile, America fares poorly, though it avoids a last-place fate. In the end, it’s Italy that ends up with the lowest score of all, confirming that raw performance can’t always beat a well-rounded package.
Not convinced? No problem. You already knew you liked Japanese cars, and who are we to say otherwise? Besides, we hear they “drive better than anything else on the road.”
This article was written for TIME by Ben Taylor of FindTheBest.
More Must-Reads from TIME
- Cybersecurity Experts Are Sounding the Alarm on DOGE
- Meet the 2025 Women of the Year
- The Harsh Truth About Disability Inclusion
- Why Do More Young Adults Have Cancer?
- Colman Domingo Leads With Radical Love
- How to Get Better at Doing Things Alone
- Michelle Zauner Stares Down the Darkness
Contact us at letters@time.com