
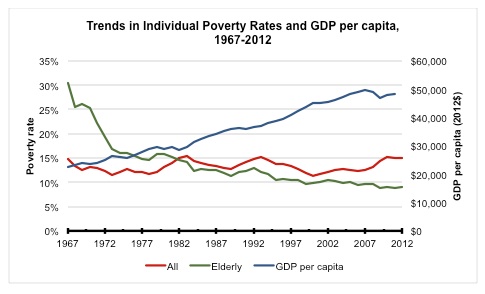
It’s been more than a half-century since President Johnson officially launched the War on Poverty, in his State of the Union address delivered on this day in 1964, and declared that the U.S. had “the power to eliminate poverty from an entire continental nation.” In the decades that followed his decision to invest in jobs, training and aid, the U.S. has experienced, by some measures, tremendous prosperity. GDP per capita—a measure of the value of goods and services produced in the U.S., a commonly used indicator of living standards–has nearly doubled, from less than $25,000 per person to nearly $50,000. At the same time, our key measure of economic hardship, the official poverty rate, has barely budged from 15 percent in the past 50 years.
On the face of it, then, the War on Poverty seems to have accomplished nothing. Critics of Johnson’s programs may also add that the War on Poverty resulted in billions of dollars spent on the poor. Why has there been no return on that investment?
The simple answer is that there have been improvements—but the way we measure poverty hasn’t, until recently, accounted for them. Many direct transfers to the poor do not count in an official poverty measure based on only pre-tax, cash income.
Many key programs established during the Great Society Era, such as Medicaid, Food Stamps (now known as SNAP) and the WIC nutrition program are “in kind” programs that provide non-cash help. In more recent decades, benefits through the tax system, such as the Earned Income Tax Credit (EITC) or child tax credits, have grown in importance but are ignored in official statistics.
Fortunately, the Census Bureau has developed their Supplemental Poverty Measure, which includes non-cash benefits and post-tax income, accounts for differences in regional costs of living and makes several other sensible adjustments to poverty measures. These adjustments can be incredibly important to understanding poverty. For example, the Census Bureau estimates that refundable tax credits, such as the EITC, lower the poverty rate by up to three percentage points (around 9 million people). SNAP benefits lower it by nearly two percentage points (approximately 6 million people).
Another critical failure of measurement, one that falls more on the community of poverty researchers, is the failure, until recently, to convincingly measure the full benefits of safety net spending. We now have credible, peer-reviewed research that measures the real benefits on health, educational attainment and quality of life from a variety of safety-net programs. These studies show over and over that many safety net programs improve the lives of the poor. For example, studies have shown that infants born to families who are at high risk of poverty are healthier because of Medicaid, SNAP and WIC. These benefits may not show up as lower poverty rates, but they lay the groundwork for a healthier, more productive populace.
It is actually remarkable that poverty rates have not substantially grown, considering economic and social trends over the past three decades. Since the 1980s, rising demand for skilled workers and falling demand for their less-skilled counterparts have meant that real wages have increased substantially for workers earning above the median, but not for most of those who earn below it. This fact is at the heart of growing inequality. It explains how strong GDP growth can co-exist with no improvement for low-wage workers. Our own research suggests that the wider gap in earnings between workers at the median and those earning in the lowest 20 percent during the 1980s should alone have increased poverty rates by roughly 2.5 percentage points.
The last 50 years have also brought massive changes in the structure of U.S. families. Since the 1960s, the fraction of the non-elderly population living in single-parent families has more than doubled. Single-parent families are more likely to be poor because, by definition, there is only one parent to earn enough to push family income over the poverty line. The cost and difficulty of child care in single-parent families pose additional barriers.
Our calculations show that if poverty rates between two-parent and single-parent families had remained constant, and only the frequency of single-parenthood had changed, U.S. poverty rates among the non-elderly since the 1960s would have increased on the order of 4 percentage points. Again, there was actually no significant change in poverty rates over this period.
A major trend identified in the graph above is the downward trend in poverty among the elderly. Unlike the overall poverty rate, poverty among the elderly has declined substantially since the 1960s. Why is this the case? First, the elderly benefit from a stable cash-based benefit from Social Security. Second, the elderly and their probability of being poor are largely unaffected by changes in labor markets. Finally, Social Security benefits are indexed to average wage growth in the economy, and so do not lose their value to inflation—in contrast with many welfare programs aimed at younger individuals.
The lesson here is that an income-support program with benefits linked to overall economic growth, aimed at a population unaffected by the deterioration of the low-wage labor market, has led to a significant, lasting decline in poverty since the War on Poverty was launched.
The War on Poverty has clearly not been won. No amount of explaining, interpreting or squinting at the plot of U.S. poverty rates can get us to a declaration of victory. Declarations of defeat are just as misguided, however. The War on Poverty has been fought against a shifting landscape that has made the effort more difficult with each passing decade. Renewed efforts that recognize demographic and labor market realities and the enormous challenges they place on anti-poverty efforts, and measures of that progress, should be the hallmarks of the next phase in this war.
Marianne Page is a professor of Economics and Deputy Director of the Center for Poverty Research at the University of California, Davis. She received her Ph.D. from the University of Michigan.
Ann Huff Stevens is a professor of Economics, Director of the Center for Poverty Research, and Interim Dean of the Graduate School of Management at the University of California, Davis. She received her Ph.D. from the University of Michigan.
The UC Davis Center for Poverty Research was founded in 2011 with core funding from the Office of the Assistant Secretary for Planning and Evaluation in the U.S. Department of Health and Human Services. It is one of three federally designated Poverty Research Centers whose mission is to facilitate non-partisan academic research in the United States.
More Must-Reads From TIME
- The 100 Most Influential People of 2024
- Coco Gauff Is Playing for Herself Now
- Scenes From Pro-Palestinian Encampments Across U.S. Universities
- 6 Compliments That Land Every Time
- If You're Dating Right Now , You're Brave: Column
- The AI That Could Heal a Divided Internet
- Fallout Is a Brilliant Model for the Future of Video Game Adaptations
- Want Weekly Recs on What to Watch, Read, and More? Sign Up for Worth Your Time
Contact us at letters@time.com