

Napa Valley gets struck by the largest earthquake in 25 years. Hurricanes churn through the Atlantic. Floods claim four lives as they sweep through parts of the Northeast. Every region in America faces its own dangers (those three are just from August), but when you account for all kinds of natural disasters–from earthquakes to winter storms to tornados–what place is safest of them all?
The honor goes to Sweet Grass County, Montana, according to an analysis of more than a half century of weather patterns and destructive natural events across the contiguous United States. Sweet Grass is home to 3,000 people who are fortunate enough to live far from wildfires to the west and twister country to the east, not to mention 900 miles from any trouble caused by the sea.
The same analysis ranks Ocean County, New Jersey, as the country’s most dangerous county, when it comes to frequency of natural disasters. Jersey Shore communities in Ocean County are vulnerable to tidal surges and storms like Sandy.
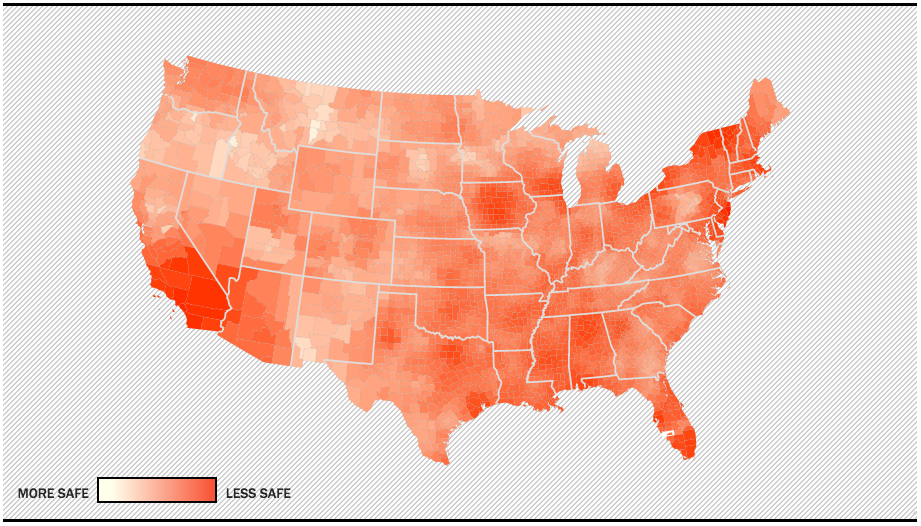
Here are the top 15 safest and most dangerous counties as measured by our “disaster index” (more on that below). Use the map above to see where your county ranks.
Safest Counties
The disaster index is calculated from all records in the National Oceanic and Atmospheric Administration storm events database, which includes earthquakes and tornados from 1950 and 42 other event types since 1996.
| RANK | COUNTY | STATE | DISASTER INDEX | 2010 POP. |
|---|---|---|---|---|
| 1 | Sweet Grass County | MT | 1.7 | 3,651 |
| 2 | Washington County | ID | 1.7 | 10,198 |
| 3 | Wheatland County | MT | 1.8 | 2,168 |
| 4 | Sherman County | OR | 2.0 | 1,765 |
| 5 | Emporia city | VA | 2.0 | 5,927 |
| 6 | Fergus County | MT | 2.3 | 11,586 |
| 7 | Luna County | NM | 2.4 | 25,095 |
| 8 | Liberty County | MT | 2.4 | 2,339 |
| 9 | Grant County | NM | 2.5 | 29,514 |
| 10 | Malheur County | OR | 2.7 | 31,313 |
| 11 | Potter County | SD | 2.7 | 2,329 |
| 12 | Hill County | MT | 2.8 | 16,096 |
| 13 | Silver Bow County | MT | 2.8 | 34,200 |
| 14 | Canyon County | ID | 2.8 | 188,923 |
| 15 | Golden Valley County | MT | 2.9 | 884 |
Most Dangerous Counties
| RANK | COUNTY | STATE | DISASTER INDEX | 2010 POP. |
|---|---|---|---|---|
| 1 | Ocean County | NJ | 223.7 | 576,567 |
| 2 | Orange County | CA | 180.8 | 3,010,232 |
| 3 | Cape May County | NJ | 174.3 | 97,265 |
| 4 | Monmouth County | NJ | 173.8 | 630,380 |
| 5 | Los Angeles County | CA | 171.0 | 9,818,605 |
| 6 | Clinton County | NY | 156.8 | 82,128 |
| 7 | Burlington County | NJ | 156.5 | 448,734 |
| 8 | San Diego County | CA | 155.8 | 3,095,313 |
| 9 | Franklin County | NY | 152.6 | 51,599 |
| 10 | Riverside County | CA | 145.7 | 2,189,641 |
| 11 | San Bernardino County | CA | 145.4 | 2,035,210 |
| 12 | Atlantic County | NJ | 143.5 | 274,549 |
| 13 | Chittenden County | VT | 143.3 | 156,545 |
| 14 | Grand Isle County | VT | 142.3 | 6,970 |
| 15 | Camden County | NJ | 139.3 | 513,657 |
Here’s how these places earned their rankings: The National Oceanic and Atmospheric Administration (NOAA) storm events database keeps track of forty-four different damage-causing natural phenomena. For earthquakes and tornados, its records go back to 1950, while all others events date back to 1996.
We tallied up every event in the contiguous United States that has caused death, property damage, injuries or crop damage in each county. Then we created a metric, called the disaster index, that is based on the average of each county’s events plus the events of its neighboring counties. A low disaster index means fewer events like dangerous storms. For example, California’s Orange County’s disaster index is the sum of its events (120) and all its neighbors events (754) divided by the count of neighboring counties plus one (5). This gives Orange County a safety index of 174.8.
When two counties have the same disaster index number, fatalities recorded by NOAA since 1950 in counties and neighboring counties are considered as part of the ranking.
All events are not equally dangerous. Hurricanes have claimed over a thousand lives in the U.S. since 1996 while wildfires have taken 99 lives during the same period. That said, counties that have very few of any of the 44 events tracked by NOAA are likely to be safest in the land, while many of those that have seen hundreds of incidents over the years are in places like hurricane-damaged New Jersey and earthquake-prone California.
Events measured by NOAA’s research include earthquake, hurricane (typhoon), cold wind chill, astronomical low tide, coastal flood, avalanche, dense fog, drought, dust devil, dust storm, excessive heat, extreme cold/wind chill, flash flood, flood, freezing fog, funnel cloud, hail, heat, heavy rain, heavy snow, high surf, high wind, ice storm, lakeshore flood, landslide, lightning, rip current, seiche, sleet, storm surge/tide, strong wind, thunderstorm wind, tornado, tropical depression, tropical storm, tsunami, waterspout, wildfire, winter storm and winter weather. You can use the drop down menu in the article’s headline to see how 3,114 counties rank in safety from each of those 44 different events.