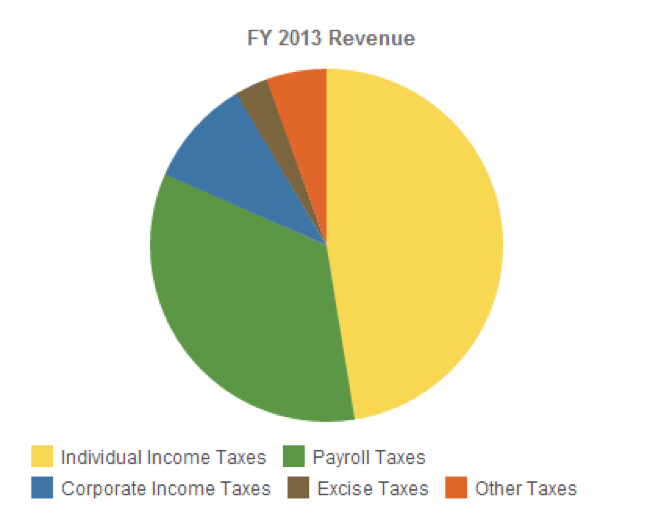
Income taxes—including taxes that are automatically withheld from paychecks—accounted for 47 percent of all federal revenue in 2013.
Payroll taxes, which are paid by employees and employers and are earmarked mostly for Social Security and Medicare, accounted for the second largest piece of the pie, at 34 percent. Workers and employers each contribute 6.2 percent of the employee’s wages for Social Security, and 1.45 percent of the wages for Medicare.
Corporate taxes—a 15-35 percent marginal tax rate on a company’s profits—were the third largest source of federal revenue, at about 10 percent.

According to the graph below, the tax landscape for individuals has stayed relatively steady as a percentage of total federal revenue since 1944, typically sitting in the mid 40’s, and sometimes dipping down into the thirties. Income taxes reached their highest percentage (50 percent) as a piece of the overall pie in 2000 and 2001.
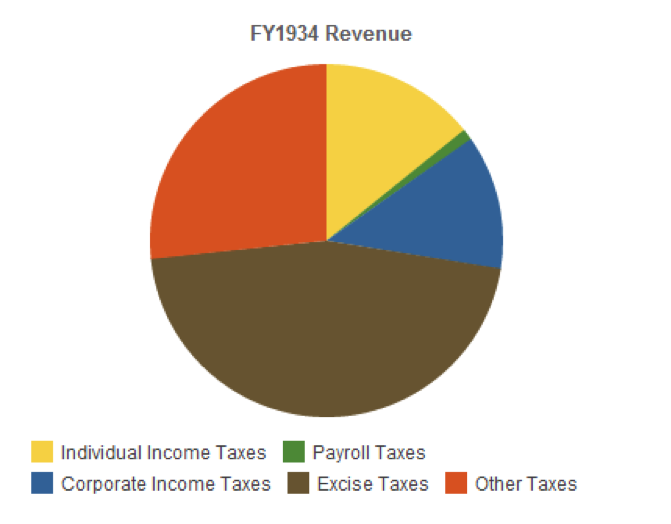
But the tax landscape was a lot different before World War II. In 1934, the earliest year with complete data from the White House Office of Management and Budget, individual income taxes accounted for 14 percent of the tax pie, while payroll taxes accounted for 1 percent, corporate taxes 12 percent, excise taxes 46 percent, and other taxes 27 percent.

Income taxes were a small piece of the pie in 1934, because the tax—enacted into law in 1913 by the 16th amendment—predominantly applied to high income earners, and exemptions were high.
During WWII, exemptions were reduced and tax rates were increased to help fund the war. Coupled with overall increases in income, income taxes as a percentage of government revenue sharply increased.
According to records from the IRS, the biggest increase came in 1943-1944. Personal exemptions decreased from $1,200 to $1,000 for married couples, tax rates for the lowest earning bracket (<$2,000) rose from 19 to 23 percent, and tax rates for the highest earning bracket (>200,000), rose from 88 to 94 percent.
Although U.S. income taxes have increased, they are about average as a percentage of GDP when compared to other OECD countries.
While income taxes rose as a percentage of federal revenue from 1943-1944, corporate income taxes did the opposite, shrinking from 40 percent of the overall pie, down to 34 percent.
Also unlike income taxes, which have stayed relatively steady as a percentage of federal revenue since 1944, corporate taxes have shrunk, reaching their lowest levels as a percentage of the tax pie—6 percent—in 1983.
In comparison to other OECD countries, U.S. corporate taxes as a percent of tax revenue (2.3 percent) fall below average (3 percent).
This article was written for TIME by Kiran Dhillon of FindTheBest.
More Must-Reads From TIME
- The 100 Most Influential People of 2024
- Coco Gauff Is Playing for Herself Now
- Scenes From Pro-Palestinian Encampments Across U.S. Universities
- 6 Compliments That Land Every Time
- If You're Dating Right Now , You're Brave: Column
- The AI That Could Heal a Divided Internet
- Fallout Is a Brilliant Model for the Future of Video Game Adaptations
- Want Weekly Recs on What to Watch, Read, and More? Sign Up for Worth Your Time
Contact us at letters@time.com