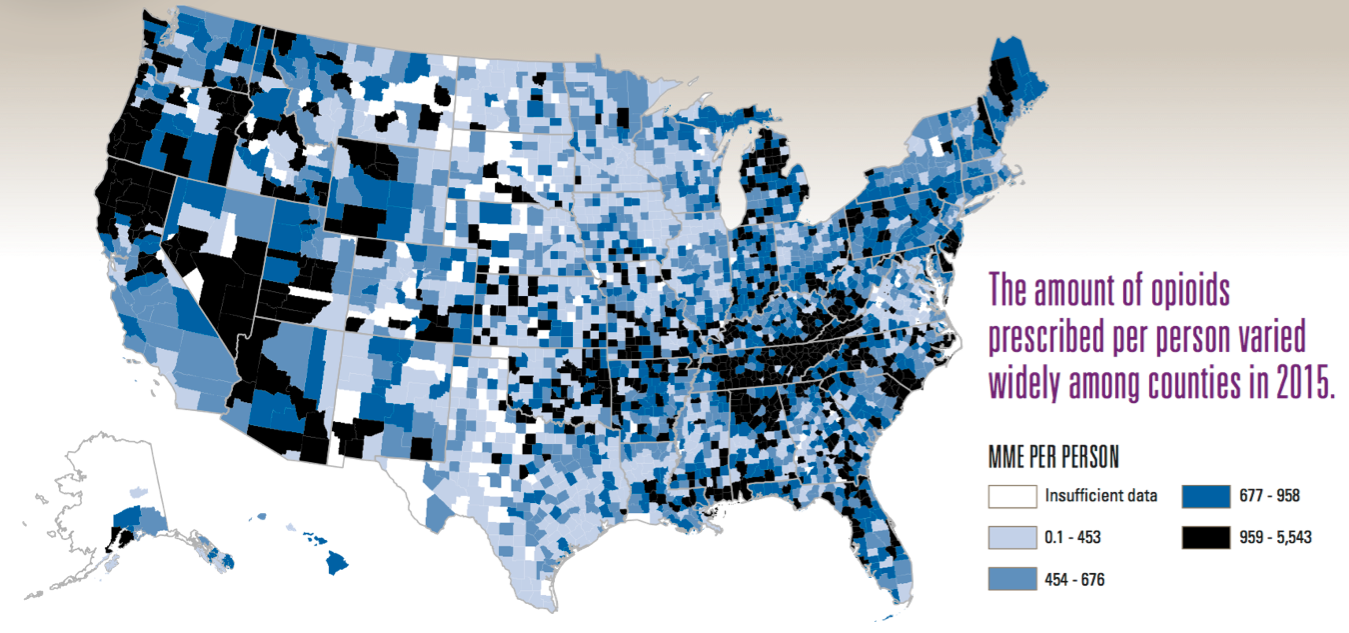
Opioid prescriptions in the United States vary widely from county to county, according to a new report from the Centers for Disease Control and Prevention.
The CDC’s Vital Signs report, published on Thursday, found that in 2015, 6 times more opioids per resident were doled out in counties with the highest prescribing rates than in the lowest-prescribing counties. Such a wide variation suggests doctors do not have consistent prescribing habits and that patients receive different care depending on where they live, according to the report.
Through analysis of county-level prescribing patterns in 2010 and 2015, CDC researchers found that higher amounts of opioids were prescribed in counties that included a larger number of white residents, more dentists and primary care physicians, a higher prevalence of diabetes and arthritis and higher unemployment. The counties also encompassed micropolitan areas, or smaller cities. Check out the map below to see the prescription variation.

The map shows that several counties where the highest numbers of prescribed morphine milligram equivalents per person, which are the amount of opioids in milligrams, are located next to counties with the least amount of milligrams prescribed.
Counties with the highest milligrams prescribed per person in 2015 — between 959 and 5,543 morphine milligram equivalents — were scattered throughout the country, and formed clusters in areas, such as northern California, southern Nevada and parts of Tennessee going into Kentucky and West Virginia. Counties with the least morphine milligram equivalents — between 0.1 and 453 per person — had a larger concentration in western and southern Texas and parts of the midwest.
More Must-Reads from TIME
- Caitlin Clark Is TIME's 2024 Athlete of the Year
- Where Trump 2.0 Will Differ From 1.0
- Is Intermittent Fasting Good or Bad for You?
- The 100 Must-Read Books of 2024
- Column: If Optimism Feels Ridiculous Now, Try Hope
- The Future of Climate Action Is Trade Policy
- FX’s Say Nothing Is the Must-Watch Political Thriller of 2024
- Merle Bombardieri Is Helping People Make the Baby Decision
Write to Mahita Gajanan at mahita.gajanan@time.com