I have seen the best brackets of my generation destroyed by madness.
The 2018 March Madness tournament is more than worthy of the name. Of the 60 games played so far, 20 have been won by the lower-seeded team. By the Sweet Sixteen, two 1-seeded teams were out of the running: Xavier, which lost to 9-seeded Florida St. in the second round, and the University of Virginia, which became the first-ever top-seeded team to fall to a 16-seed in the first game. Meanwhile, an 11-seed, Loyola-Chicago, won in the Elite Eight to reach the Final Four for only the fourth time.
This is not mere anarchy. It is complete lunacy. By TIME’s calculations, there has never been a wilder Men’s College Basketball tournament since March Madness expanded to 64 teams in 1985.
To determine this, we quantified “madness” by looking at the historical fates of all 2,176 teams that have entered the tournament in the modern era, and awarded a certain number of “luna”—the self-declared metric unit of madness—based on how uncommon each outcome has been over the past 34 years. The following table ranks each year by madness. Keep scrolling to see how we did it.
Here’s how it works: For each of the first four rounds, including 2018, we tallied how many times each seed has advanced. For example, a 1-seed has survived to the second round 135 of 136 times, appeared in the Sweet Sixteen 116 times, the Elite Eight 94 times, and the Final Four 56 times. Those figures drop precipitously for lower-seeded teams.
While it might seem reasonable to measure madness simply by the number of upsets, weighted to the differential in seeds, not all upsets are created equal. A 12-seed defeating a 5-seed in the first round might seem like shock, but anyone who regularly follows the tournament knows that this happens all the time—47 times in 136 contests, to be exact. (The number of historical matchups is four times the number of years since there are four “regions” of 16 seeds each.) Meanwhile, a 15-seed has unseated a 2-seed only eight times.
Madness, in fact, is not simply a tally of lower-seeded teams beating better-regarded opponents. It is a factor of how unusual and unexpected the outcome is overall. Using the historical data, one can precisely measure how unlikely every outcome is, from highly common to extraordinarily rare.
To pin this down to an aggregate level of madness for each year, TIME considered every matchup in which the seed of the winning team has won that round fewer than 25 times since 1985. That threshold of 25 was determined through repeated trial-and-error to extract only the outcomes that were genuinely uncommon.
To calculate the number of luna for each historic upset, we looked at the number of times fewer than 25 that it has ever occurred—so, 11 if it has happened 14 times, and so forth—and then squared that figure, since very, very rare outcomes deserve considerably more weight than those that are slightly more likely. Again, this strategy was born of repeated iterations on the model with results tested on college basketball impresarios.
For example, when Loyola-Chicago defeated Nevada in the Sweet Sixteen this year, it became only the eighth 11-seed to advance to the Elite Eight, garnering 289 luna – that’s (25 – 8)^2.
Applying this logic to the first four rounds of every year’s tournament (so that it was possible to compare the current tournament’s results so far to every past year), 2018 has the highest madness in history with 2,935 luna. The 2013 tournament, which had a crowded lineup of low-seeded victories, came in a close second with a score of 2,928.
Curiously, for all the attendant griping after the NCAA Selection Committee releases its roster of 64 teams from seeds 1 to 16 in the four regions, the historical data indicates that the seeds are highly predictive of the outcome, particularly early in the tournament. In the first round, for example, the higher-seeded team has always won a majority of time proportionally to how big a difference there is between its seed and its opponent’s seed. The only exception is the four annual matchups between 8 and 9 seeds, which are split evenly with 68 victories apiece since 1985.
The TIME formula for madness, however, is largely seed-agnostic. While it uses the winning team’s seed to calculate the historical frequency that this seed advances to each round, the value of the seed itself does not enter the calculation. It just so happens that the seeds enter the picture organically, since the lower a team’s seed, the less common it is for that team to win.
To be sure, there are infinite ways to quantify madness. We feel good about this one, which was not doctored so as to produce a result that made for the best headline. And for what it’s worth, the calculations were conducted in a state absent any personal basketball-related madness, even though this reporter attended the University of Virginia. After all, it’s almost time for baseball.
Methodology
Historical results were manually compiled from a variety of sources to ensure accuracy. To ensure the most apt comparison, all calculations of previous years were conducted with the same historical data from 1985 to 2018, even though those results are retroactive to previous years. (Otherwise, the 1985 tournament would achieve the maximum possible number of luna, since, as of that time, none of the outcomes had every happened before.) These figures will be updated with the results of the Final Four and Championship games as the 2018 tournament reaches its completion.
For those keeping score at home, here’s the formal definition of madness:
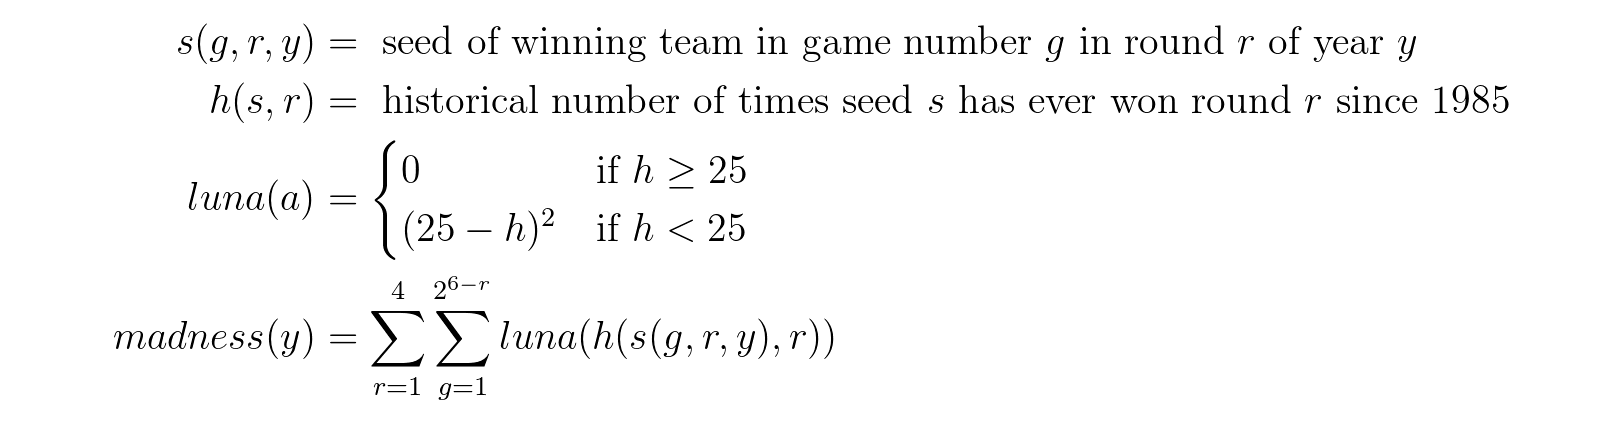
Have a better idea for how to calculate madness? Let us know, and we’d be happy to run the numbers, so long as it uses the same core set of historical data. (Sorry. We lack the bandwidth to factor in the color of each team’s jerseys.)
More Must-Reads From TIME
- The 100 Most Influential People of 2024
- The Revolution of Yulia Navalnaya
- 6 Compliments That Land Every Time
- What's the Deal With the Bitcoin Halving?
- If You're Dating Right Now , You're Brave: Column
- The AI That Could Heal a Divided Internet
- Fallout Is a Brilliant Model for the Future of Video Game Adaptations
- Want Weekly Recs on What to Watch, Read, and More? Sign Up for Worth Your Time
Write to Chris Wilson at chris.wilson@time.com