
What if I told you that there was a period in history where oil demand declined by 5 million barrels per day and non-OPEC supply increased by 5 million barrels per day, yet oil price rallied more than 50 percent? Would you believe me?
If your answer is yes, then you guessed right. This was the period from 1979 to 1985; it was a period during which global oil demand declined from over 61 million barrels to 56 million barrels and non-OPEC supply increased from 32 million barrels to 37 million barrels. Yet prices rallied from $17 a barrel in 1979 to $26 a barrel in 1985, while reaching as high as $35 in 1981.
This illogical world of rising prices, collapsing demand and expanding non-OPEC supply was made possible by a 15.5 million barrels reduction in OPEC’s supply between 1979 and 1985 as OPEC cut production from 30.5 million barrels in production in 1979 to 15 million barrels in 1985, and most of that reduction was voluntary.
The maintenance of this artificially high price band by OPEC (at the expense of its production) led the oil majors to increase their capex from $24 billion in 1979 to as high as $44 billion by 1982, which naturally resulted in a drilling explosion with annual O&G wells drilled increasing from 66,000 in 1979 to a peak of 107,000 in 1984. This investment and drilling frenzy lead to more than a doubling in the Finding and Development (F&D) costs from $5 per barrel in 1979 to around $12 by the mid-1980s.
Oilprice.com: 35% Of Public Oil Companies Could Face Bankruptcy
The increase in the F&D cost during that time was not the result of resource scarcity, or extraction complexity, it was the product of a substantial inflation in service costs due to an unexpected surge in activity caused by manipulated prices. Once OPEC ceased manipulating the market, prices quickly reverted back to their pre-manipulation economic equilibrium level in the mid-teens, while F&D costs settled back into the $5 a barrel range.
This unfortunate price manipulation episode by OPEC led to the creation of substantial overcapacity in the petroleum industry as it brought forward and accelerated the development of unneeded oil resources, it greatly reduced demand, and it created significant excess capacity within OPEC itself. It took the world until 1991 to achieve the same level of oil demand reached in 1979, then from 1991 it took the world a decade and a half of demand growth and the emergence of China in the early 2000s, to exhaust all that non-OPEC excess capacity and OPEC spare capacity that was created during the 1979 to 1985 timeframe.
The birth of a new bull market
The 1979-1985 oil bull market is what a manipulated market looks like, and this market has no resemblance to the bull market that preceded the current price collapse. Unlike the early 80s price surge, oil prices were not manipulated higher in the early 2000s, but rose due to natural supply and demand forces.
In 2005 oil prices averaged $54 per barrel, a near doubling from the $28 per barrel at the start of the decade. 2005 is often mentioned as the official start of the 2000s raging oil bull market that lasted for almost ten years, except for a brief interruption following the financial crisis.
Between the years 2000 and 2005 OPEC increased its crude and NGL production by 4 million barrels per day, inching up total production from 30.7 million to 34.8 million barrels, however this was insufficient to meet the over 7 million barrels per day growth in global demand growth during this period, with OPEC excess capacity virtually eliminated, the additional increase in supply had to come from non-OPEC sources.
However, after rising from 46 million bpd to 49 million bpd (all liquids) from 2000 to 2004; non-OPEC supply stalled at around 49 million bpd for 3 years from 2004 to 2006, before finally crossing into the 50 million bpd mark in 2007. The pressure on non-OPEC to increase production could only translate into a sizable increase in prices, which in turn encouraged the industry to significantly increase its capex spending.
World supply hits a wall … U.S. supply to the rescue
Yet, as prices exploded higher and capex spending hit record after record, something curious happened: Non-OPEC all liquids supply (ex-U.S.) ground almost to a halt, after crossing 43.4 million bpd barrels in 2007, non-OPEC (ex-U.S.) all liquids supply increased by a measly 1.5 million bpd over a 7 years period, a period during which demand increased by over 6.6 million bpd.
As a matter of fact, between 2010 and 2014 non-OPEC (ex-U.S.) supply did not grow at all as it averaged around 44.5 million bpd for five years, while demand increased by 4.1 million bpd during this time. OPEC did marginally better than non-OPEC supply (ex-U.S.), OPEC production stagnated at 34.6 million bpd from 2007 to 2010, before increasing to 36.6 million bpd by 2014, or increasing by 2 million bpd from 2007 to 2014 (OPEC did cut supply in late 2008 and 2009 in response to the financial crises).
Oilprice.com: A Home-Battery System that Could Rival Tesla
Powered by the shale revolution, U.S. supply was a different story, from 2010 to 2014 U.S. all liquids supply grew by 4.2 million bpd, thus meeting the totality of global demand growth in the 5 years preceding the current crisis. Eventually, the strong increase in shale production combined with the resumption of growth in OPEC production led to prices collapsing by late 2014.
So very different, so very the same
This brief oil market history illustrates the substantial difference between what transpired in 1979-1985 and what happened between 2005 and 2014. While the 1980s oil bull market was an unquestionably manipulated market that was bound to collapse at some point, the 2000s oil bull market was mostly driven by market fundamentals. The resolution to the last oil bull market was delivered by market forces as high prices unleashed new sources of supply, namely U.S. shale oil. This was different from the 1986 oil price collapse which was triggered by OPEC ceasing its doomed effort to artificially inflate oil prices.
Yet, OPEC hands are not completely clean in this price collapse episode. The oil price collapse of 2014 was compounded in 2015 by the arrival of geopolitically restricted oil from several OPEC countries. Iraq increased its production by 650,000 bpd in 2015. This supply should have been added to the market many years ago, but due to decades of turmoil, this oil only made it to the market last year. Saudi Arabia’s decision to bring in some of its spare capacity to the market (450,000 bpd production increase) last year also added to the oversupply situation that was created by market forces.
Additionally, politically restricted oil from Iran is being introduced to the market in 2016, thus yet again contributing to the oversupply. The sizable increase in Iraqi, Saudi and Iranian oil exports to the market in 2015 and 2016 has created (unintentionally or intentionally) the reverse of the OPEC price manipulation episode from 1979 to 1985. This time oil prices are being forced lower by a geopolitical oil supply increase that has little to do with market supply and demand fundamentals; just as OPEC aggressively withdrawing oil supply from the market in 1979 to 1985 had nothing to do with supply and demand fundamentals.
What now?
The surge in shale oil production between 2010 and 2014 was the trigger to this oil crisis, and thus a reduction in non-OPEC supply through a reduction in shale/global oil capex is a proper response to shale’s oversupply. This is how free markets balance themselves.
However, the arrival of the above mentioned geopolitical oil has interfered with the natural balancing mechanism. As oil prices overshot to the downside (and stayed low) due to the arrival of the geopolitically constrained non-market sensitive oil, the O&G industry has been forced to under invest in future oil supply as cash flows dried up and financing costs skyrocketed. The extent of under investment in shale has even been more severe with capex cuts averaging double the global average.
The substantial capex-to-supply lag for most of non-OPEC oil and OPEC’s unwillingness to restrict production or gradually ease back the increase in geopolitical supplies has forced an undue burden on shale/tight oil to balance the market on its own. Yet the shale balancing mechanism is far from perfect, shale while relatively fast moving in comparison to other sources of supply, is still a much less efficient balancing tool in comparison to OPEC. This in turn means the market is lacking the proper tools to balance itself in a timely manner in order to avoid a supply crisis down the line, as the ongoing large capex cuts flow to all non-OPEC supply (as well as some OPEC supply) through higher decline rates, and deferred or cancelled greenfield supply projects.
This delayed rebalancing caused a large build up in global inventories; those excess inventories could act as a shock absorber of sorts once supply undershoots, but it remains unclear whether excess inventories alone or in combination with OPEC will be able to compensate for an eventual dual collapse of both shale and non-OPEC supply in the context of sustained demand growth.
Oilprice.com: This Is What Will Cause A Lasting Oil Price Rally
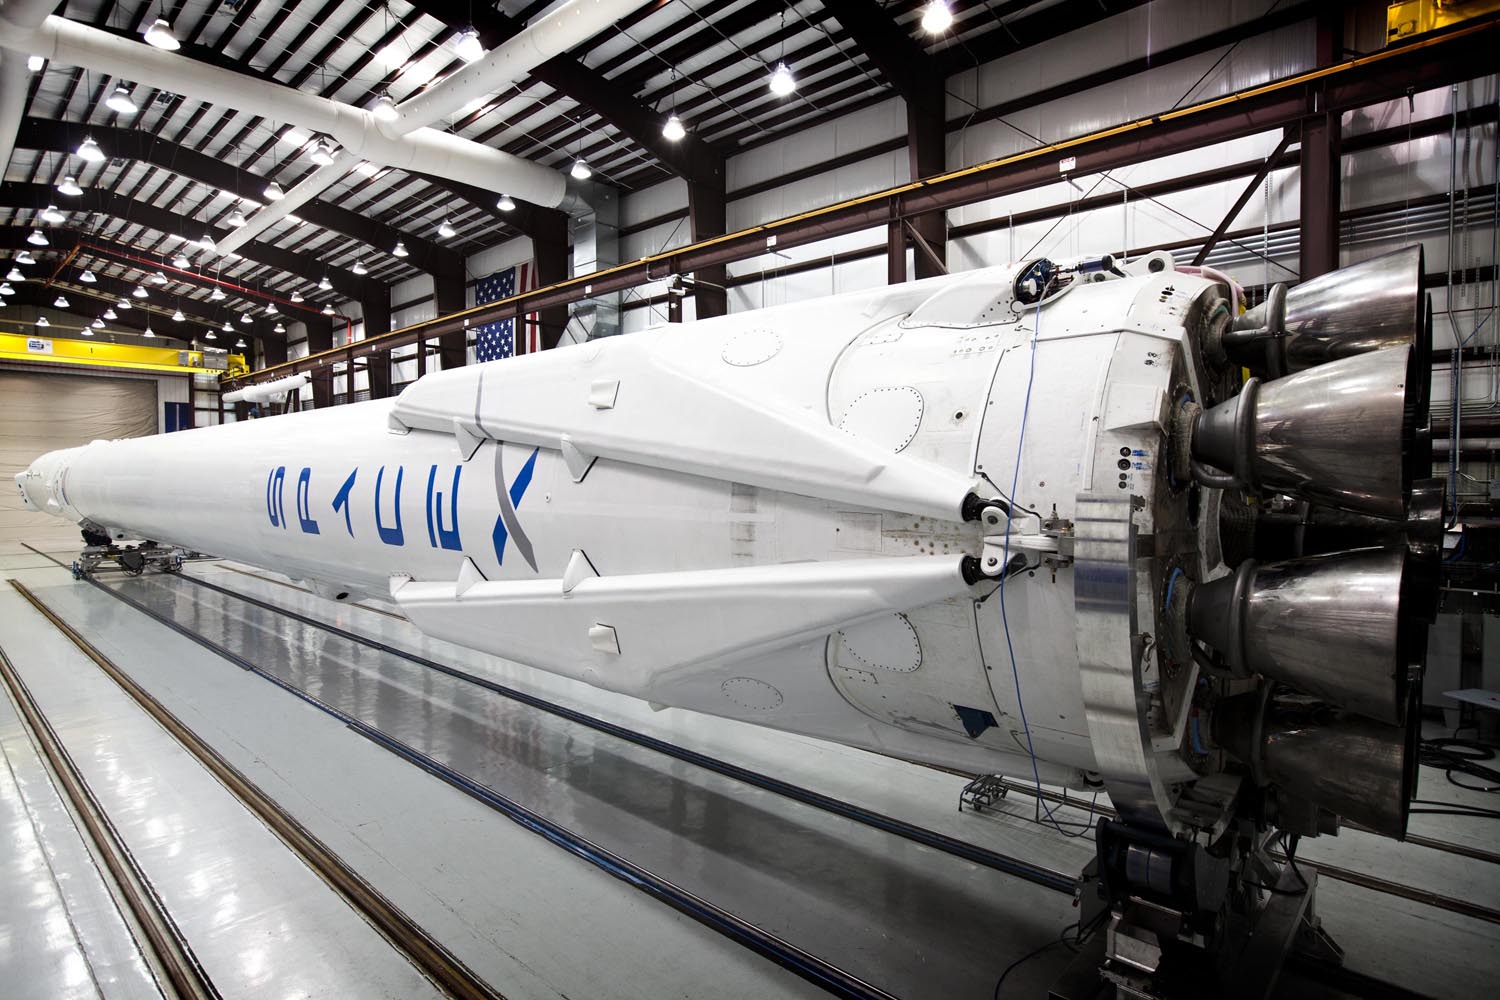
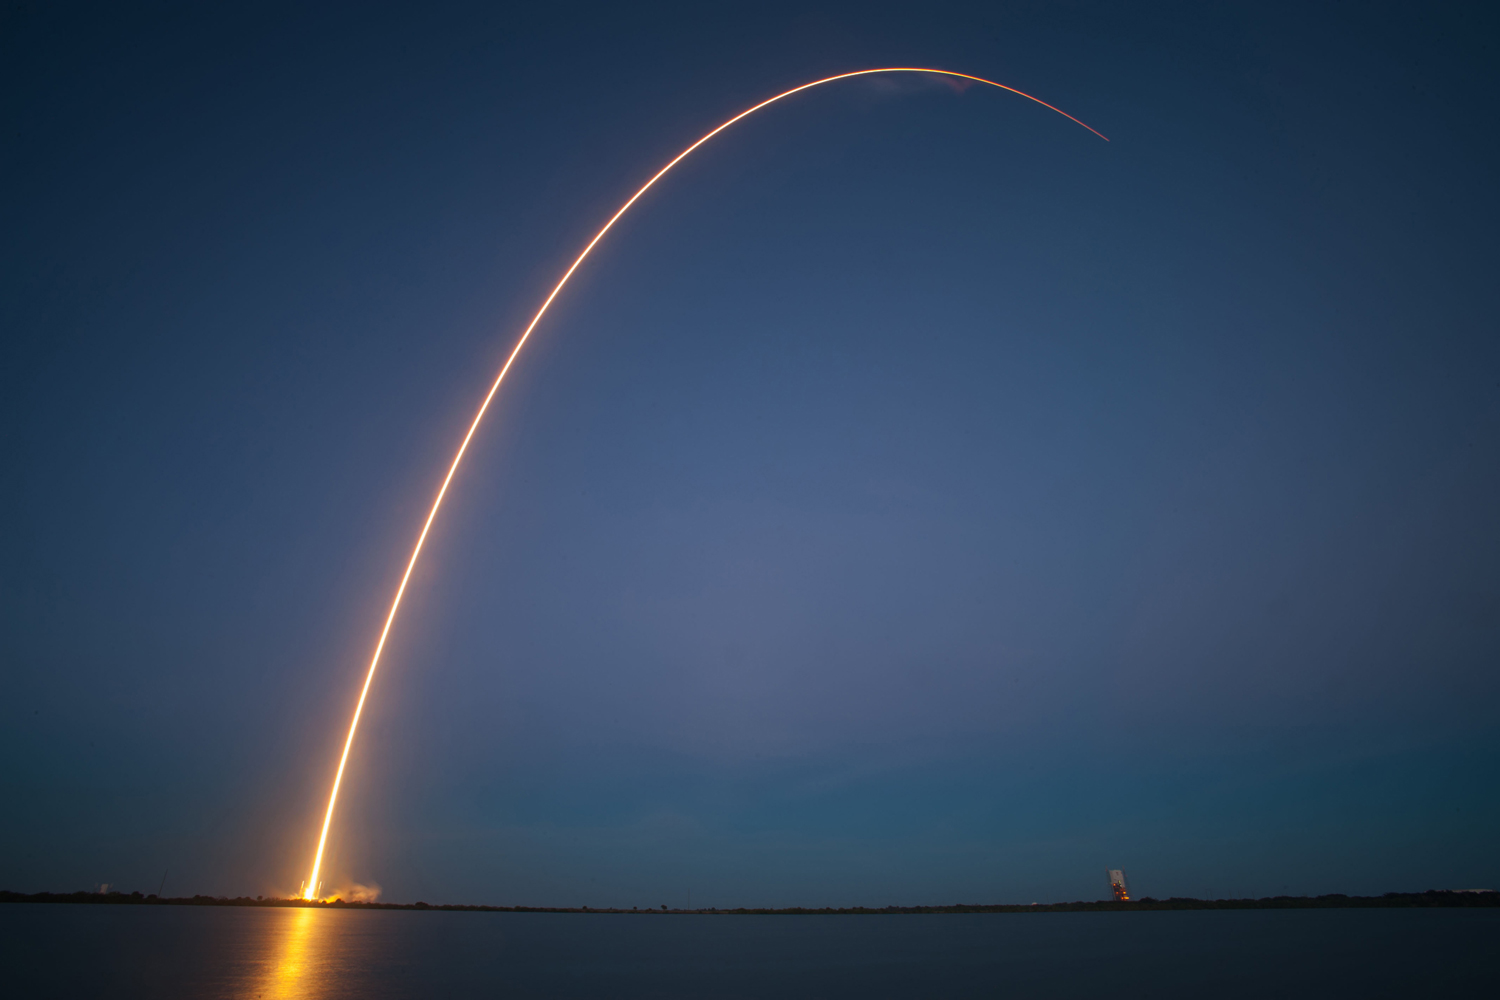
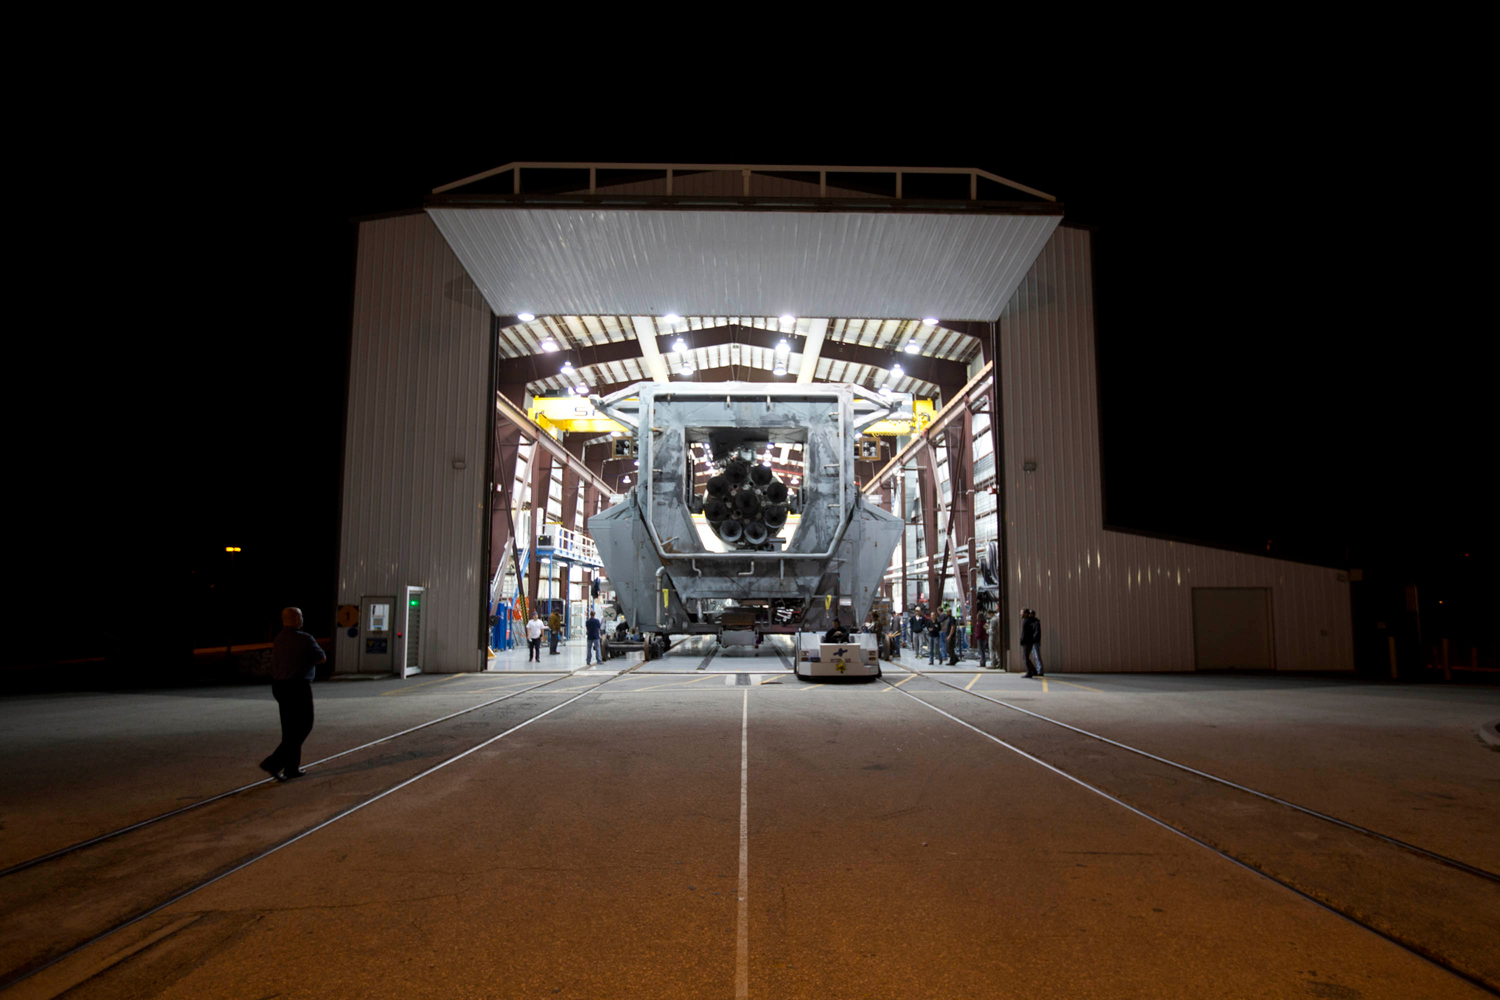
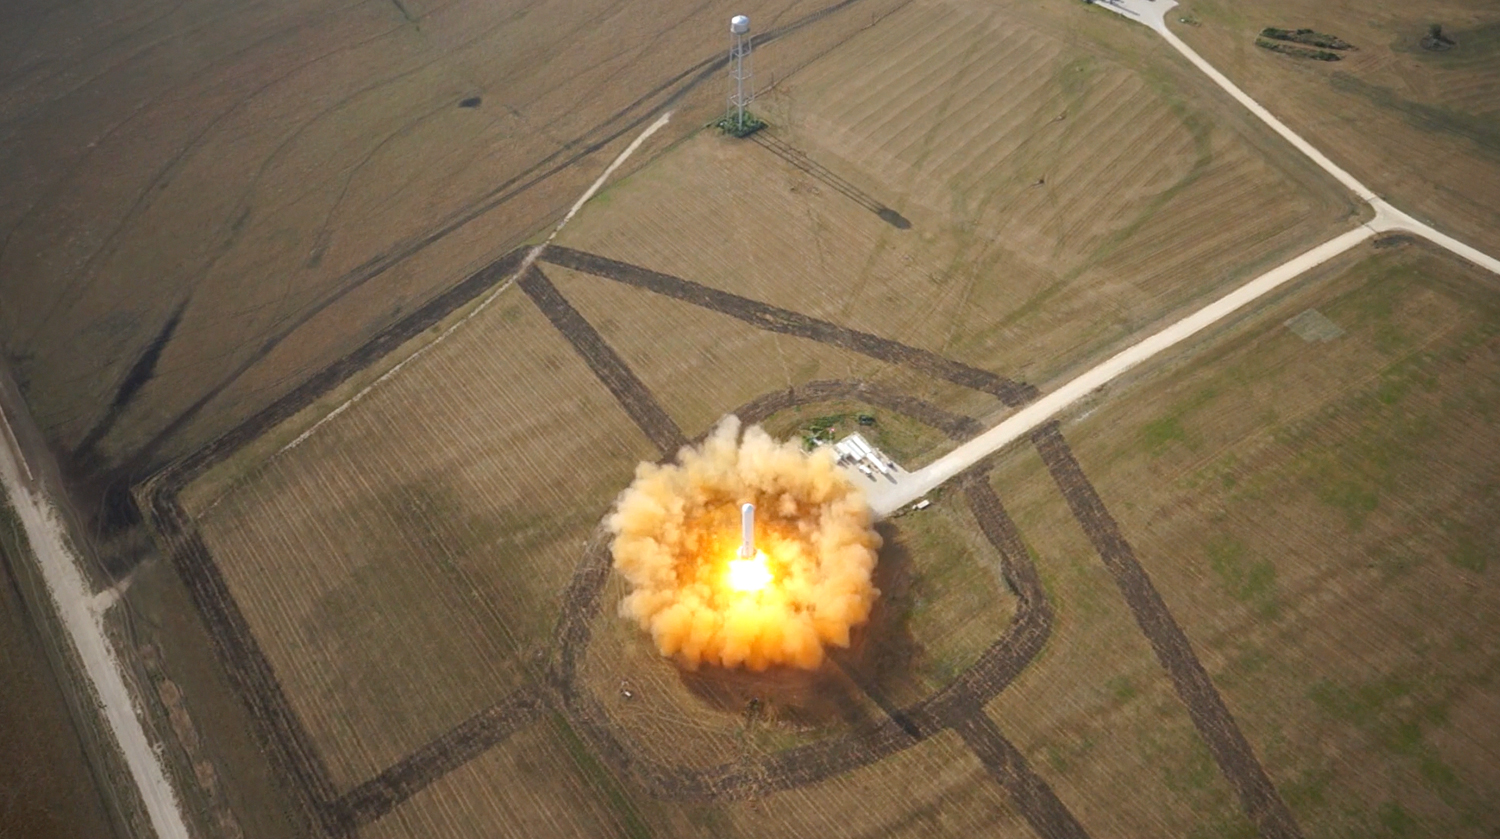
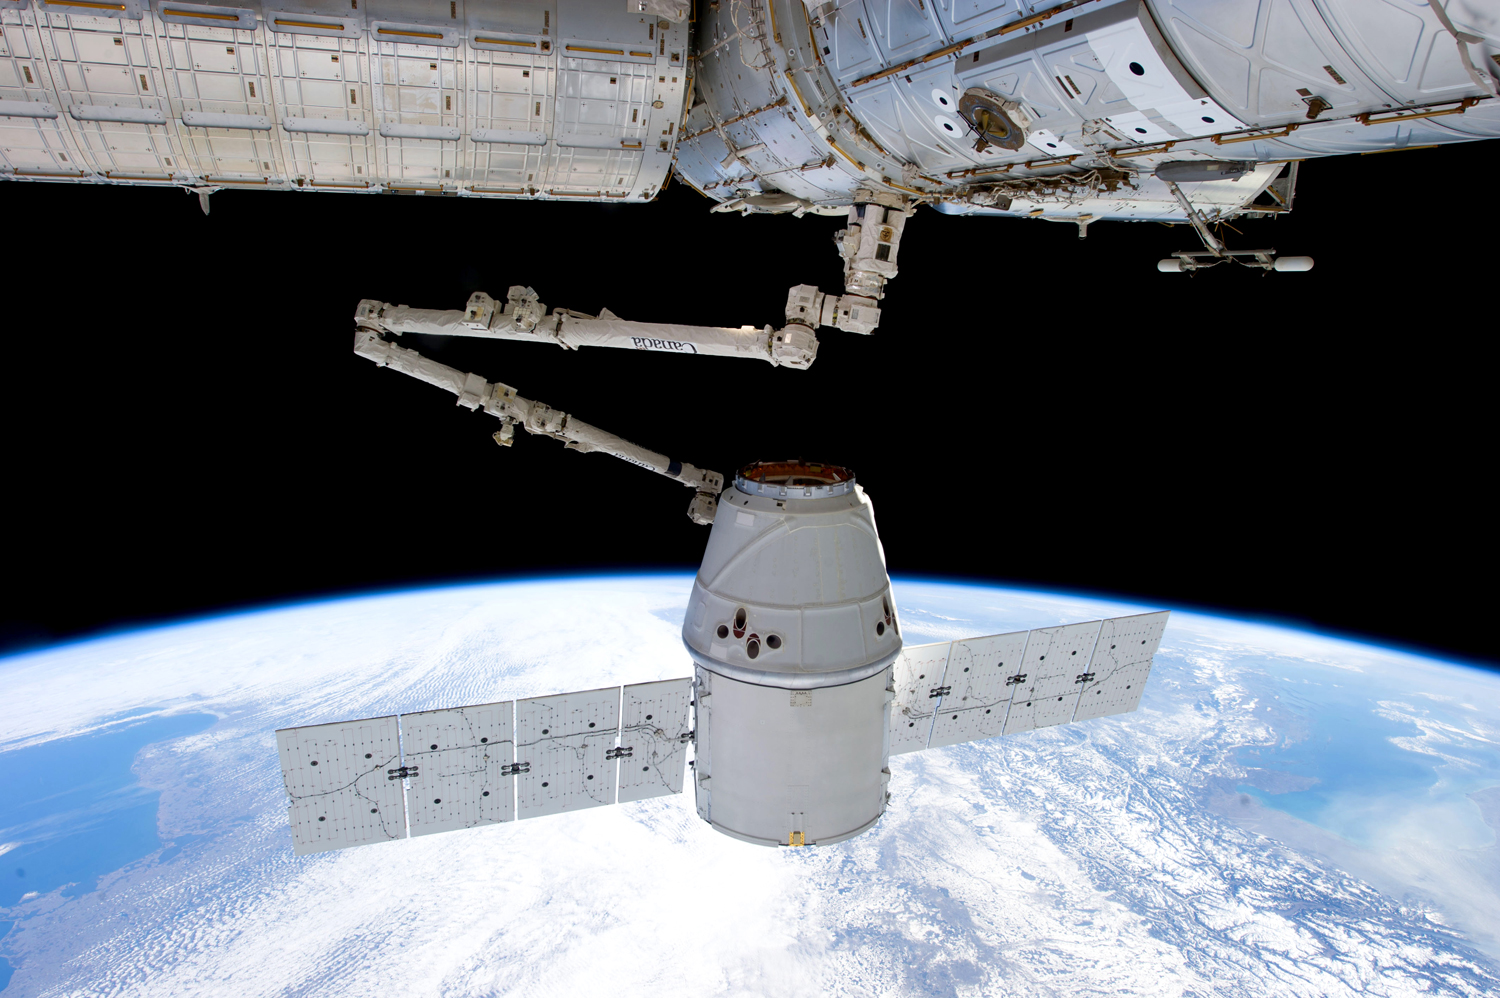
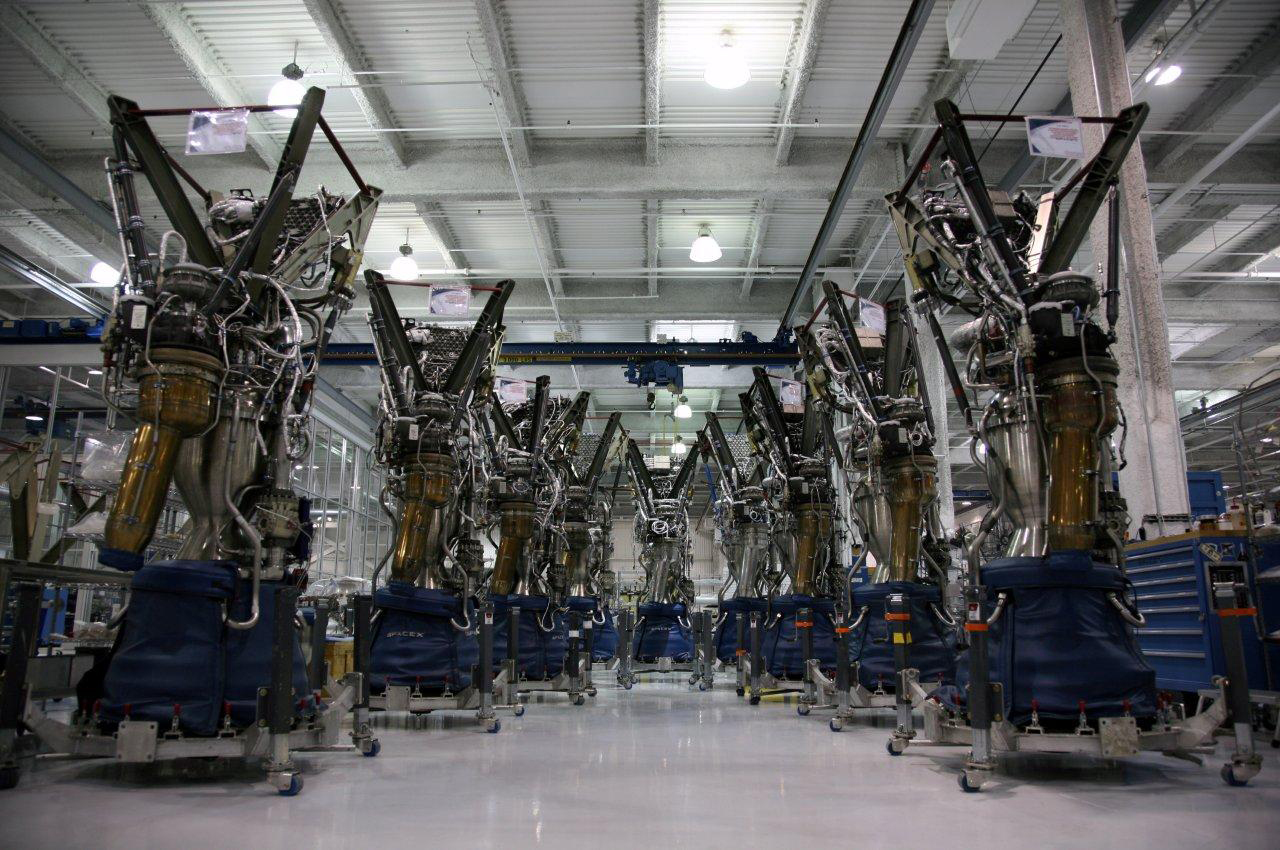
PHOTOS: See SpaceX's Biggest Milestones


Conclusion
This oil boom-bust cycle is not a repeat of the 1980s, however the arrival of shale oil to the global oil scene has created a new oil pricing reality. Nonetheless, it is highly unlikely that this new oil reality is anywhere close to $30 or $40 a barrel as the futures curve is indicating and many forecasters are forecasting.
Outside of Iran and Libya, OPEC is producing close to its maximum capacity, with little prospect of a sizable increase in supply over the next several years. In essence, OPEC alone is not in a position to compensate for shale and non-OPEC declines as well as meet future demand growth. Yet, for shale and non-OPEC to assist OPEC and grow a price in the $60 to $70 range is most likely required to incent the development of marginal oil reserves.
By 2017 as global demand and supply come into balance, and inventories start to draw oil prices may snap back substantially above the $60-$70 price range as the market transitions from a flood to a drought at some point next year, however once the next price spike period settles down as shale production catches up to demand once again, prices will likely settle in the $60 to $70 range long term, and remain there until the next noticeable change in demand/supply fundamentals or until the arrival of unforeseen geopolitical events.
This article originally appeared on Oilprice.com
More Must-Reads From TIME
- The 100 Most Influential People of 2024
- The Revolution of Yulia Navalnaya
- 6 Compliments That Land Every Time
- What's the Deal With the Bitcoin Halving?
- If You're Dating Right Now , You're Brave: Column
- The AI That Could Heal a Divided Internet
- Fallout Is a Brilliant Model for the Future of Video Game Adaptations
- Want Weekly Recs on What to Watch, Read, and More? Sign Up for Worth Your Time
Contact us at letters@time.com